Wednesday, August 21, 2013

Brazil, Tobacco and Lung Cancer: Facts and Figures


André Medici

Kaizô Beltrão
Introduction


May 31st is celebrated by the World Health Organization (WHO) as the World No Tobacco Day. Why? (a) Because tobacco is a major risk factor for a number of chronic diseases such as cardiovascular disease, cancer of the lungs, trachea and bronchi, respiratory problems and many, many others, and (b) because 20% of the adult world population consume tobacco products.

About two-thirds of users are concentrated in fifteen countries. They are China (27.2%), India (10.4%), Indonesia (4.5%), Russia (4.1%), Bangladesh (2.3%), Brazil (2.2%), Pakistan (2.0%), Poland (1.9%), the Philippines and Turkey (each with 1.5%), Vietnam (1.4%), Mexico and Thailand (each with 1.1%), Egypt and Ukraine (each 1%) (1). According to these data, the BRICS (2) (excluding South Africa) concentrate almost 44% of smokers, which shows that the future health of this group of countries is still somewhat smoggy.

It is estimated that in 2011, 6 million deaths were directly related to tobacco, 80% of which occurred in middle and low-income countries. But tobacco does not cause damage only to those smoking by their own free will. Exposure to tobacco leaves many sequels to those who, even without smoking, live daily with smokers in housing, the workplace, in social living spaces such as restaurants, bars, markets, and other public and private spaces. Even based on 2011 estimates, about 600,000 people (an additional 10% to the number of deaths directly related to tobacco) died from exposure to tobacco every day without ever having smoked, of whom 75% were women and children (3). Moreover, even quitting smoking, the derived tobacco health sequelae remain in the ex-smokers burden of disease. So the best would be to invest in campaigns that encourage young people not to smoke, or if they do, to stop smoking as soon as possible, because the sooner this occurs, the lower the future health sequelae due to tobacco.
 
Based on this argument, many governments and health plan operators, worldwide, have invested in economic and social policies against tobacco. Governments try to increase taxes on tobacco to avoid the habit of early smoking among young people and the poorest, often with good results. But as a corollary, the Ministries of Finance are hostages of revenues from taxes levied by tobacco and sometimes are the first to resist more radical measures that reduce the consumption or production of tobacco through other routes, such as the prohibition of smoking in public places, a ban on cigarette advertising or incentives to replace tobacco production areas for other less profitable plantations, using public subsidies to producers (given the high economic return of agricultural production of tobacco, which usually occurs in oligopsonic conditions with prices fixed by the sector multi-national companies).
Moreover, for the lower-middle income groups, especially those with lower education as "the new affluent middle classes", cigarette consumption is relatively inelastic to higher prices and thereby, increase the taxation passed on to consumer prices ends ceasing to be effective as a policy to reduce consumption.

With regard to health plans, strategies that have worked are those based on the use of higher premiums affecting smokers, subsidies linked to treatment for those who want to quit smoking and decreases in the value of premiums for those who leave the addiction. Operators of U.S. health, such as Kaiser Permanente, have used this very expedient. The sources additionally spent with subsidies and premium cuts for those who quit smoking, is saved on future cash flows for avoiding hospital costs associated with chronic and acute cases treatment, especially in terminal patients with incurable consequences of tobacco.

However, the best solution for governments and health plans is to educate the population to quit smoking. One successful way to prevent the increase of tobacco consumption are campaigns through media or even the smokers' health warnings with horrendous pictures placed on cigarette packs, as has been done in Brazil. Many other countries have implemented this program and it reduced tobacco consumption over the past few years, through planting an anti-smoking seed in the hearts and minds of current and potential smokers and in the whole society.
 
Tobacco Consumption in Brazil
Brazil is the sixth largest tobacco consumer’s country in the world with respect in absolute figures. Countries like the United States, with a population 50% larger than the Brazil consumes less tobacco. However, Brazil has been the target of successful public campaigns (lead by the Ministry of Health or the State and Local Governments) in reducing tobacco, passing by: (a) restricting the use of smoking in public spaces(bars, restaurants and workplaces); (b) reducing planted areas dedicated to tobacco production and promoting its replacement by other crops, through a program implemented by the Ministry of Agrarian Development (MDA) (4), and; (c) promoting a great deal of anti-tobacco advertising, financed by the Government through various forms of media.

From the point of view of education and promotion of anti-smoking campaigns, the National Cancer Institute (INCA-autarchy linked to the Ministry of Health) manages the National Program to Combat Smoking. These campaigns, among other actions, train professionals from State and Municipal Health Departments for educating the public on the evils of smoking in schools, businesses, hospitals and communities, with activities developed in partnership with the three levels of government (federal, state and municipal).

Moreover, levels of tobacco taxation in Brazil are high. In some areas of the country, this fact leads to increased smuggling and illegal entry of tobacco products in Brazilian territory, from other countries, such as Paraguay. But even in spite of all the risks to the contrary, such actions have intensified in the last twenty years, bringing the number of people who smoke in Brazil to reduce. Between 2003 and 2008, according to data from the national house hold (PNAD) produced by the Brazilian Institute of Geography and Statistics (IBGE), the percentage of smokers in Brazil was reduced from 18% to 17% of the population over 15 years, reaching about 25 million people in 2008 and reversing the upward trend that still prevailed in the previous decade.
 
Participation rates of smokers by gender in 2008 were quite different: 21% among men and 13% among women. The first graph shows the percentage of people aged 15 and over who use tobacco in Brazil, according to Region (Brazil is divided into 5 regions: North, Northeast, Southeast, South and Mid-West).
The data show that in all regions the prevalence of smoking is higher among men than among women. It also indicates that in two regions (North and South) the prevalence among men is higher than in other regions, while among women, the highest prevalence of smoking is found in South and Southeast. Anyway, it is emphasized that the South is the Region with the highest proportion of smokers compared to the others, for both men (23%) and women (16%). The lowest rates of smoking prevalence among men occur in the Southeast and Midwest (21%) and the lowest for women in the North (10%). However, according PNAD 2008, regional differences in the prevalence of smoking among men are not large, while among women are significant.


On the other hand, as showed in Table 1, the number of smokers in Brazil is larger than the number of ex-smokers, indicating that there were massive behavioral changes that have taken large numbers of smokers to quit the habit. In 2008, the proportion of people over 15 who gave up smoking was 17% (19% for men and 14% for women).

Table 1: Percentage of people over 15 who quit using tobacco by region:
Brazil (IBGE - PNAD 2008)

Region
Total
Men
Women
Brazil
17.2
19.3
13.9
North
17.6
20.1
15.2
North East
16.7
18.1
15.6
South East
15.8
19.3
12.7
South
17.0
20.9
13.4
Mid West
17.2
20.1
14.5

In some regions, the proportion of women who quit smoking was higher than the proportion of women smokers, such as the North, Northeast and Midwest, but this does not occur among women in South and Southeast and among men of any Region. Graph 2 shows the ratio between smokers and people who have quit smoking. In regions where this ratio is lower than 1, there is a slower pace to quit smoking, while where this ratio it is greater than one, the number of former smokers already exceeds that of smokers.


Another relevant factor is the intensity of smoking. The 2008 PNAD researched, in this respect, the daily or occasional smoking habit for smokers and for former smokers. Table 2 shows the percentage of frequent smokers and former smokers who smoked daily.

Table 2: Percentage of People over 15 who are daily smokers and former smokers who smoked daily by Region: Brazil (PNAD - 2008)

Regions
Percentage of Population Who Smoke Daily
Percentage of Former Smokers who Smoked Daily
Men
Women
Men
Women
Brazil
18.9
11.6
16.1
10.7
North
17.2
8.6
14.5
10.2
North East
18.1
10.4
14.7
12.1
South East
19.0
12.3
16.5
9.9
South
21.1
13.9
17.9
10.4
Mid-West
19.0
10.7
17.2
11.0


The data reveal that the number of daily smokers is greater than the former smokers who smoked daily for both men and women. It is noted that the total number of female daily smokers was smaller than the number of women former smokers who used tobacco daily (5).

Latest data on smokers and nonsmokers in Brazil are in VIGITEL (6), which is a survey of risk factors for chronic diseases made by telephone, conducted by the Ministry of Health. The 2011 VIGITEL data has many methodological and conceptual differences regarding the variables associated with tobacco surveyed by PNAD and therefore both surveys cannot be compared. VIGITEL investigates the smoking habit among the population over18 years (meanwhile PNAD used 15 years and more) and has different forms of regional aggregation of data. The representativeness of the PNAD is national, while VIGITEL is limited to state capitals. VIGITEL also investigates the issue of passive smoking and the degree of their exposure to tobacco.
According to data from VIGITEL 2011, the proportion of adults who smoke in the capitals ranged between 8% (Maceio) and 23% (Porto Alegre). The largest proportions of smokers were found among men, in Porto Alegre (25%), Curitiba (24%) and São Paulo (22%), and among women, in Porto Alegre (21%), São Paulo (17%) and Curitiba (17%). The lowest proportions in males occurred in Salvador (11%), Maceio (11%) and Recife (13%) and, among females, in Aracaju (4%), Maceio (5%) and João Pessoa (6%).

Considering the aggregate population of the state capitals and the Federal District surveyed by VIGITEL, one can see that the proportion of smokers was 15%, higher among males (18%) than among females (12%). For both sexes, the proportion of smokers tended to be lower before age 25 or after age 65. The proportion of smokers was particularly high among men and women with up to eight years of schooling (23% and 15%, respectively), exceeding by almost twice the proportion observed among individuals with 12 or more years of schooling. Thus, larger investments in education, while raising awareness and capacity for discernment of the population, could reduce the proportion of smokers among the young population.


VIGITEL data show that, the proportion of former smokers adults in the state capitals had varied in a range between 16% (Aracaju) and 29% (Rio Branco). The highest proportion of former smokers were observed among men in Manaus, Rio Branco and Boa Vista (all three capitals with 33%) and among women in Rio Branco (26%), Porto Velho (23 %) and Curitiba (22%). The lowest proportions of former smokers among men were observed in Salvador, Recife and Aracaju, all with 20%, and among women in Aracaju (14%), Federal District (14%) and Goiania (15%).

Another important subject is the intensity of smoking. VIGITEL researched the proportion of individuals who reported smoking 20 or more cigarettes per day (heavy smokers), which in 2011 ranged between 1% (Salvador) and 11% (Porto Alegre). Among men, the highest proportions of heavy smokers were observed in Porto Alegre (13%), Curitiba (9%) and Campo Grande (8%), and among women, in Porto Alegre (9%), Rio de Janeiro (6%) and São Paulo (4%). The lower proportions of heavy smoking among men were found in the Distrito Federal, Maceio, Salvador and Belém (all with 2%) and among women in Salvador (0.6%), Boa Vista (0.9%), Teresina and São Luís (1.1%).

VIGITEL also surveyed the issue of second hand or passive smoking - those people who live or work in the presence of active smokers - being involuntarily exposed to tobacco. The proportion of people considered passive smokers in households varied between 9% (Maceio) and 17% (Macapá). Among men, the highest proportions were observed in João Pessoa (15%), Boa Vista (15%) and Macapá (14%) and among women in Macapá (19%), Recife (17%) and Teresina (17%). The lowest proportions among men were observed in Maceió (6%), Goiânia (7%) and Rio de Janeiro (8%) and among women, in Victoria (10%), Distrito Federal (10%) and Curitiba (11%).

Given that it is difficult to avoid passive smoking at the households by public enforcement, the best way to control directly passive smoking is at the workplace. In Brazil it is forbidden by law to smoke in the work place since the early 2000s, but companies and even government agencies do not enforce the law in their premises. In consequence, VIGITEL data shows that in 2011, the proportion of passive smoking in the workplace ranged between 8% (Florianopolis) and 19% (Porto Velho). Among men, the highest rates of passive smoking at workplace were observed in Porto Velho (28%), Belo Horizonte (23%) and Palmas (22%) and among women in Belem (11%), Macapá (10%) and Boa Vista (10%). The lowest proportions among men were observed in Florianopolis (11%), Curitiba (14%) and São Paulo (15%) and among women occurred in Manaus (4%), João Pessoa (5%) and Porto Alegre (5%).

Based on these data, we could test a large set of hypotheses about the effects of smoking on the population health status. However, it is not always possible to have all the evidence to produce reliable statistics based on causal models. What is known is that one of the direct consequences of smoking is lung, trachea and bronchi cancers. What could be said about that in Brazil?

The Consequences of Smoking in the incidence of cancer in Brazil

Pulmonary Cancer (including lung, trachea and bronchus´ cancers) is the second highest incident cancer among men and the 5th most common among women in Brazil. Of the 27,600 new cases expected in 2012, 65% may occur among men and 74% are concentrated in the Southeast, according to estimates from the National Cancer Institute - INCA (7). Although the incidence is correlated with age, it is estimated that 80% of cases are associated to tobacco consumption. Avoiding tobacco consumption should be the best way to reduce the incidence.
The remaining cases of lung cancer may be associated with urban quality of life. Unhealthy household environments and workplaces, air pollution as result of transport systems based in cars, buses and trucks, industrial production without environmental safeguards and lack of green spaces, especially in big cities, also favors the emergence of pulmonary cancer.

Table 3 shows the incidence rates of lung, trachea and bronchi cancers in 2012 in Brazil and Regions. Observe that, for both sexes, this incidence was higher in the South, where is also the highest proportion of smokers among the population over 15 years. The North presents itself as having the second largest share of smokers in the male population and next to the lowest share of smokers in the female population, but their estimates of cancer incidence for both sexes are the smallest of all the regions. The Southeast is the second region with the highest incidence rates of pulmonary cancer, which are also associated with a high proportion of smokers in the population.
Table 3: Incidence of lung, trachea and bronchi by Region: Brazil 2008

Regions
Estimated Incidence Rates of Pulmonary Cancer per 100 thousand inhabitants (INCA 2012)
Men
Women
Brazil
17.90
10.80
North
8.11
5.12
North East
8.52
5.64
South East
19.73
11.22
South
37.02
18.58
Mid-West
16.64
9.3

 
Having all this data, even at the risk of falling into the ecological fallacy (8), some correlations between smokers and ex-smokers (according to data from the National Household Survey 2008) and estimates of the incidence of lung, trachea and bronchi (according to the data INCA 2012) were build. Table 4 shows how the regression coefficients (R2) associated with the different correlations performed.


Table 4 - Regression Coefficients for Different Correlations between variables related to population data on smoking (PNAD 2008) Estimates of Incidence of Lung Cancer, trachea and bronchi in Brazil (INCA 2012) second Sex and Region


Variables Used to make correlations with the pulmonary cancer incidence
Regression Coefficient (R2)
Linear
 Model
Exponential Model
Percentage of smokers as a share of the total population aged 15 years and more
0.3515
0.3994
Percentage of the former smokers as a share of the total population  aged 15 years and more
0.2393
0.1945
Percentage of smokers and former smokers as a share of the population aged 15 years and more
0.3228
0.3292
Percentage of daily smokers as a share of the population aged 15 years and more
0.4892
0.5575
Percentage of daily former smokers as a share of the population aged 15 years and more
0.3950
0.3780
Percentage of daily smokers and daily former smokers as a share of the population aged 15 years and more
0.4665
0.4975
Percentage of smokers as a share of the population aged 15 years old and more adjusted by the average age of the population by Region and gender
0.5810
0.6275
Percentage of daily smokers as a share of the population aged 15 years old and more adjusted by the average age of the population by Region and gender
0.6774
0.7842

Although the interval between variables with smoking and incidence of lung cancer is 4 years, it is worth noting that the PNAD data are collected in September 2008. On the other hand, estimates of cancer incidence for 2012 were built in 2011 based on historical series of incidence from 2000 to 2010. In this sense, there is not a great time delay between the real data of smoking and the incidence of lung, trachea and bronchi, according the data used.

The data showed that the correlations between pulmonary cancer incidence and former smokers are not high. Some explanations can be linked to the fact that PNADs’ data on former smokers contains no information about the time when the person quit smoking. The strongest correlations were found between the percentage of frequent smokers and the incidence of lung cancer. Even so, given that the Regions have different age structures, the age variable could be affecting the correlation of variables such as lung cancer incidence and smoking. That's because Regions with an older profile (such as South and Southeast) have a larger number of people who smoke for a longer time (everything else constant), being more likely to suffer from lung cancer which is also associated with age.
 
To circumvent this problem graph 3 correlates smoking population with lung, trachea and bronchi cancer incidence, using, as variable to represent smoking population, the percentage of frequent smokers with the average age of the population of each region by gender. It results a correlation (the exponential model) close to 0.8, which coincides with international evidence that says that 80% of cases of lung cancer are related to smoking. The graph has 12 points (Brazil and 5 Regions for men and women).


Final Thoughts


The fight against tobacco has yet to face a long journey to achieve the reduction of the incidence of cancer. Socio-economic factors such as low educational level of the population, the effect of rising incomes and rapid demographic and epidemiological transition may prevent, in the coming years, faster than desired reductions in tobacco consumption among users of the SUS (Brazilian public Health system), in spite of the Government efforts in promotion and prevention programs and television campaigns against tobacco, besides legislation and enforcement on the reduction of public spaces for tobacco use.

Among the private health plans´ insured population, the use of more effective incentives to quit smoking such as premium reductions or rewards benefiting new non-smokers, could accelerate the reduction in tobacco consumption.

But both among users of SUS and those who use the private health plans, there remains the hope to reduce tobacco consumption, allowing that the national day against tobacco should be not just one, but every day of the year. The political economy to implement these policies is not so easy, since even a ban on smoking in public spaces, in Brazil, has the risk of civil disobedience given the high costs and lack of staff to enforce it. For these cases, the most effective way is to rely on the conscience of everyone in the process to respect the law and monitor compliance.

End Notes


(1) According to Bloomberg Philanthropies Website, 2012, available at http://www.mikebloomberg.com/BloombergPhilanthropies2011TobaccoReport.pdf

(2) Group of Countries including Brazil, Russia, India, China and South Africa, considered as the future drivers of world economic development.

(3) Estimates of the central area of ​​health, population and nutrition of the World Bank.

(4) Brazil, Ministry of Agrarian Development: Actions of the Ministry of Agrarian Development for the Diversification of Production and Income in Areas of Tobacco Cultivation in Brazil, MDA-SAF, 2010.

(5) Data from IBGE-PNAD 2008 allow a more detailed analysis of the conditions that could explain the transitions between the smoking habits for the condition of non-smokers.

(6) Brazilian Ministry of Health VIGITEL Data investigates the population of the state capitals and the Federal District.

(7) Ministry of Health, INCA, Estimate 2012 - Incidence of cancer in Brazil, Ed INCA, Rio de Janeiro (RJ), 2011, 118p.

(8) In epidemiology, ecological fallacy occurs when performing analyzes with results derived from aggregate values ​​per unit area, implying that these values ​​correspond to the individual level. This type of analysis can generate results that can give rise to incorrect analysis about a particular phenomenon.


Friday, April 26, 2013

Latin America and the Caribbean Region: Champion in Reducing Child Mortality

André Medici 


Introduction


Despite the existence of pessimistic analyzes, health in Latin America and the Caribbean has improved significantly in recent years. This improvement should be attributed overall to the regional economic development, to the massive public investment in social policies and to the social and demographic dividends characterized by increasing rates of urbanization, better educational levels (especially for women) and improvements in water and sanitation systems . Between 1990 and 2008, life expectancy at birth in Latin America increased from 68 to 73 years old, reaching higher levels than the world average (69 years) and all other developing regions.


The good performance of Latin America in extending life span is evident when compared with Eastern Europe and Central Asia countries, where life expectancy at birth in the same period increased by only one year (69 to 70 years old), starting from a higher level but getting a lower level than the Latin American Region at the end of the period. Childhood malnutrition (measured by low weight at birth) reached in 2008 only 4.5% of children under five years old - the lowest value across all Development Regions, including Eastern Europe and Central Asia. In contrast, 7.2% of Latin American children at this age group became overweight - a factor that may contribute to the early incidence of chronic diseases.

In 2010, immunization rates for DPT3 and measles reached more than 90% of the target population. The prevalence of HIV-AIDS reached only 0.5% of the population between 15 and 49 years old, lower than the world average (0.9%) and the Eastern Europe and Central Asia Regions (0.6%), although higher that of high-income countries (0.3%). The incidence of tuberculosis had fallen to 47 per 100 000 inhabitants and almost 80% of cases are reported regularly by health services, value which is surpassed only by the countries of the Middle East and North Africa, among all developing regions.

However, maternal mortality is still high in the region. In 2008 it reached 130 per 100,000 – a higher level than those in Eastern Europe and Central Asia but lower than all other Development Regions. About three-quarters of Latin American women used regularly contraceptives, which is an equivalent level of high-income countries. Thus, fertility rates were reduced dramatically and many LAC countries, achieved levels below the replacement rates.

Access to water and sanitation reached 78% of the Latin American population in 2006, a figure surpassed only by high-income countries (100%) and countries of Eastern Europe and Central Asia. Through it all, the main health problems in the Region are no longer the diseases associated with poverty (malnutrition, maternal and infant causes and transmissible diseases) and became to be the chronic conditions. Population aging is accelerating as well as the demand for more sophisticated and expensive health services and, in many countries, such as Chile, Uruguay and Costa Rica, avert infant mortality depend more of efficient and well equipped hospitals.

But better health indicators performance in Latin America in recent years is not due only to achievements in health policies. It results also from a combination of successful policies of macroeconomic stabilization, economic growth and social development implemented in the last twenty years. On the health policy side, it also responds to actions focused on improvements in primary care. This set of factors has not been able to eliminate the deep inequality that is still reflected in health indicators but turn possible sound improvements in health outcomes in the region. Among these results it could be highlighted the fast reduction of infant mortality, which has been the focus of attention of international organizations and institutions as a way to fight against poverty in the developing countries.
 
Reducing Infant Mortality in Latin America and the Caribbean 

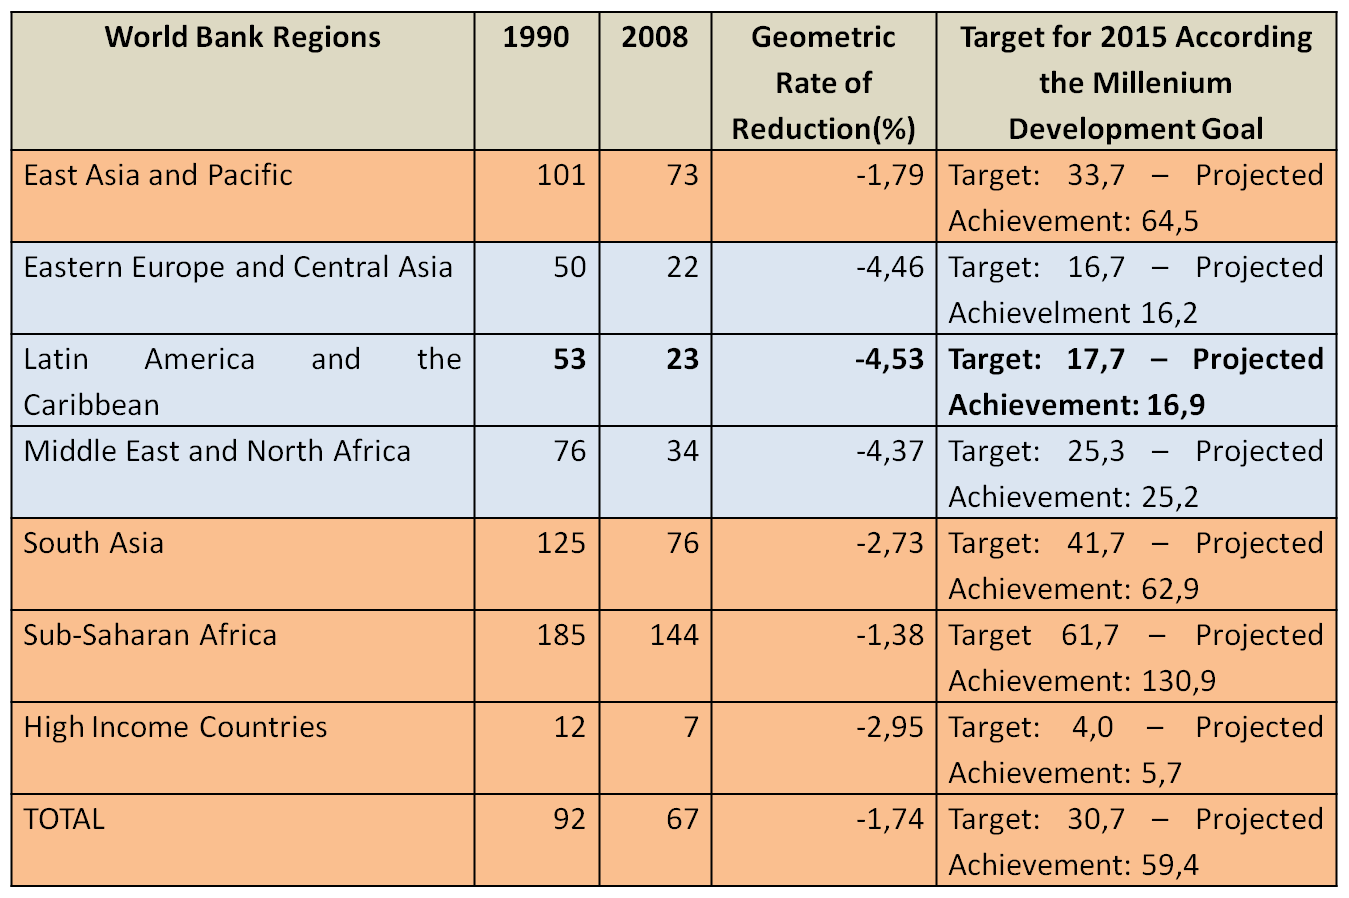
Between 1990 and 2008, the Latin America and the Caribbean Region got a fast reduction in the mortality rates for children under five years old, with an annual decrease of 4.53%. Keeping the same pace, the Region will be one of the few that will reach the Millennium Development Goal target of reducing child mortality by two thirds in 2015 (see table 1). The high-income countries, even reaching lower infant mortality rates, are not keen to achieve this target of the Millennium Development Goals. 

Table 1 - Mortality Rates of Children under 5 Years Old:
1990-2008 (per 1000 live births)

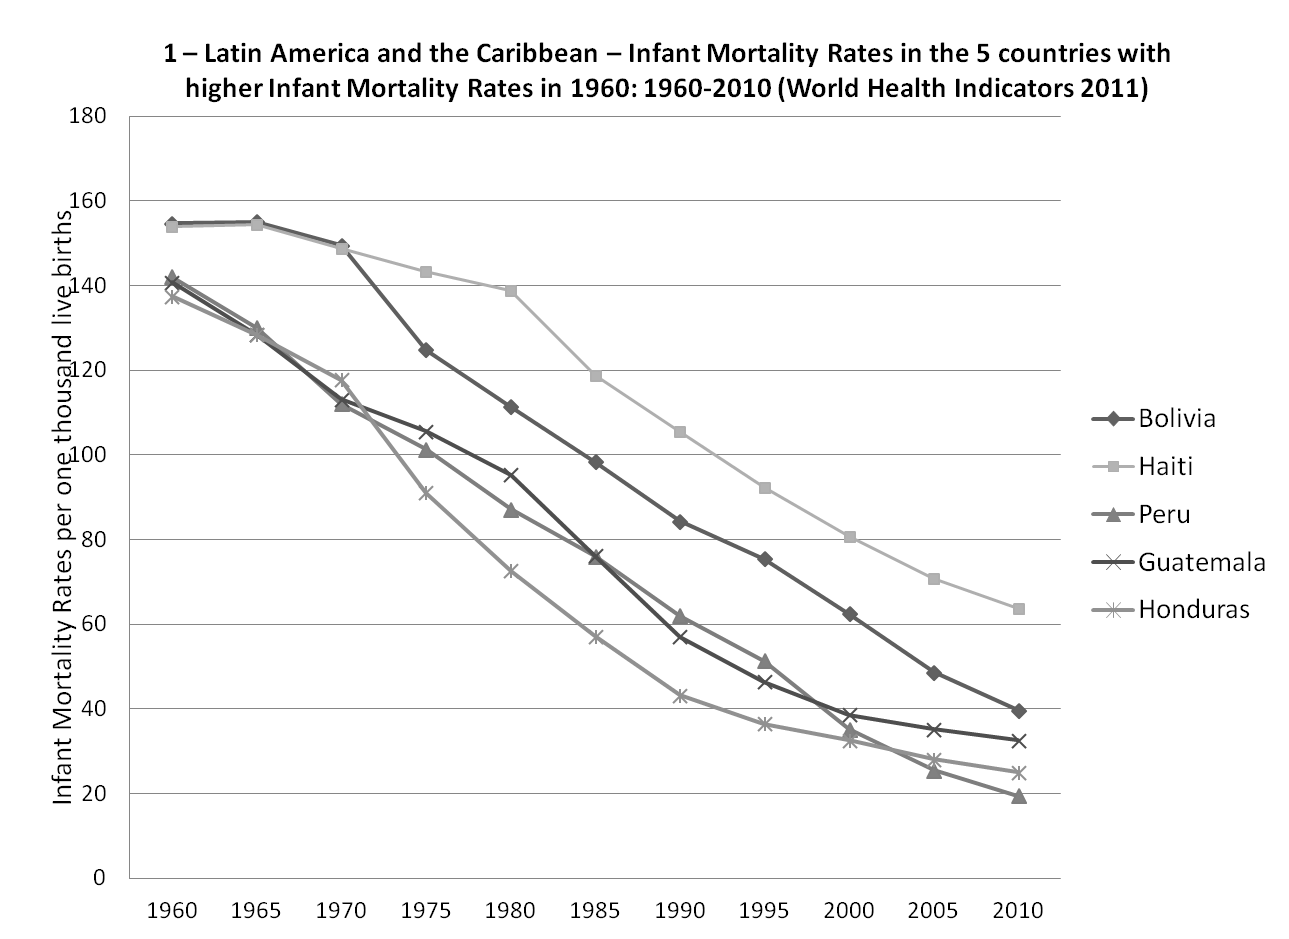
The infant mortality rates in Latin America presented big disparity among countries in the early 60s’. Countries like Bolivia and Haiti, for example, in 1960 had rates close to 160 per thousand, nearly four times higher ​​than those for Cuba, who always had lower infant mortality rates throughout the Region. Graph1 shows the infant mortality rates reduction over a half a century (1960-2010) in the five countries with higher levels of this indicator in 1960, which were Bolivia, Haiti, Peru, Guatemala and Honduras.


During this period, despite the fantastic reduction of child mortality in these five countries, the disparity in the level of infant mortality was increased. Haiti was the country with the lowest reduction turning from the second position in 1960 to the highest infant mortality rate in the region in 2010. Even so, the reduction was from 154 to 64 per thousand live births. Bolivia, which had the highest infant mortality rate in the region in 1960, showed a significant reduction (almost four times) - from 155 to 40 per thousand deaths in 2010. However, Peru, Guatemala and Honduras had the largest reduction, lowering their rates between four and six times, passing from 140 per thousand to levels between 20 and 35 per thousand live births.

Another way to see the evolution of infant mortality in LAC is to analyse  to the countries that had the lower infant mortality rates (Cuba, Uruguay, Jamaica, Argentina and Trinidad and Tobago) in the sixities, it could be shown in Graph 2  the reduction on the infant mortality rates between 1960 and 2010.


Cuba, the country with the lowest infant mortality rate in 1960 (40 per thousand) - continued to hold this position in 2010. Its rate was reduced by almost ten times during the period, as result of a health policy focused on mother and child primary care. The infant mortality rate in Cuba in 2010 (4.4 per thousand) is similar to the countries of the European community. Countries like Argentina and Uruguay, with infant mortality rates between 50 and 60 per thousand around 1960, also suffered significant reductions in this indicator, with their rates reaching in 2010 11 and 13 deaths per thousand live births respectively. However, the same did not happen with the largest countries in the English Caribbean - Jamaica and Trinidad and Tobago. In these two countries, infant mortality rates not only decreased slightly (around half) and stagnated (Jamaica) or even increased (Trinidad and Tobago) in 1985. Another way of analyzing the infant mortality trends in the region in recent 50 years is to compare countries that delivered minor and major efforts to reduce this indicator. 

Let us begin by countries that undertook major efforts. The top five are Chile, Cuba, El Salvador, Costa Rica and Peru (see chart 3). Infant mortality rates in these countries, which in 1960 presented large discrepancies (between 40 and 140 per thousand live births) began in 2010 to converge to values
​​located between 5 and 20 per thousand live births.


In Chile, the reduction was more than 13 times, from 106 to 7 per thousand over 50 years. Chile, in 2010, reached the second highest position in the regional ranking of this indicator. In Cuba, as already noted, the reduction was ten times. In other LAC countries, such as Peru, El Salvador and Costa Rica, the reduction was also quite significant. 

On the other hand, some countries apparently struggled and had worse results in the fight to reduce child mortality: they are they Trinidad & Tobago, Jamaica, Haiti, Paraguay and Bolivia (see chart number 4). Trinidad & Tobago and Jamaica - countries that in the sixties were among the five who had lower rates of infant mortality in the region, had the worst performance in reducing this  indicator compared with other in the Region. Another country with equally performed poorly in this indicator is Paraguay, which even with relative high infant mortality rates in 1960, did not registered good results in the reduction of this indicator over the past 50 years.


Haiti and Bolivia are among those with the five highest infant mortality rates in the LAC Region. However, they are also among those with the worst results in the infant mortality rates in the last fifty years. Also are included as worst performers, countries such as Trinidad and Tobago and Jamaica. Although, some of the five members of the group with lower rates in 1960 were not able to maintain this position in 2010. 

Accordingly, the champions in maintaining low infant mortality rates in Latin America and the Caribbean between 1960 and 2010 are Cuba (4.4), Chile (7.0), Dominica (8.1), Bahamas (8.5) and Barbados (9.8). But with the exception of Chile, all of them had relatively low rates in 1960. 

What matters, therefore, is to know what could be associated with the effort made ​​in reducing child mortality. Reviewing the last fifty years performance, it is undeniable that Chile has been the Latin American champion in the reduction of infant mortality. For this purpose, health policy makers, since the eighties, prioritized the strengthening of primary health care strategies at the local level, transfering responsabilities from central to local governments to fight infant mortality and giving technical and financial support to municipalities for this purpose.

Sunday, April 7, 2013

Health in Venezuela: Over a Decade of Missed Opportunities


André Medici


Introduction

Hugo Chavez was one of the most innovative populist presidents of recent times in Latin America. He managed to circumvent the rules of representative democracy and tried to perpetuate himself in power. He made permanent the possibility of re-election and changed the electoral rules, co-opting congressmen eager for handouts, controlling the media, violating freedom of expression, taking the space of political opposition, arresting political adversaries and spending fortunes on propaganda and dissemination of his image and ideology at the expense of the public pocket.

Despite all his efforts, Chávez’s economic and social policies had not brought the expected results for the half of the population that has learned to love him during the period 1998 - 2013. His death on March 5, 2013, on the one hand creates a feeling of abandonment for the half of the population that revered him as one more of the fathers of Latin Americans’ poor, but on the other hand renews the hope of the other half of the Venezuelan population, embarrassed by the failure of recent past years and eager to return the country to gain traction in the race for social and economic development.

Chávez was able to give affection to the poor Venezuelans and increased their self-esteem through the cult of national roots and of hatred between classes in a highly polarized and fragmented society. His government silenced the voice and denied the rights to the majority of the middle class and business elites of the country, creating political space for his followers to enlarge disproportionately the state and to hijack the productive sector through nationalizations of private companies, controlled by few, in the name of socialism of the XXI century.

With his bragging behavior, he used the space gained in the international media to bluster poorly educated words against the governments of developed countries and twisted desperately, but in vain, so that they respond strongly, as a way to feed his political speech in favor of a late and meaningless third-worldism.

Chavez policy improved a little the income distribution in the country, illiteracy was reduced and the share of poor declined from 49% to 30% of the population between 1999 and 2011, but other countries in the region had even better results in these areas. Moreover, improvements in income distribution do not always entail better quality of life, especially when there is no adequate economic growth.

The country had not progressed in bringing economic development and quality jobs for the suffered Venezuelan population. Chavez used the country’s public money and natural resources to support other governments that might compose a world hub with its Bolivarian resistance against the policy of developed countries. The billions of dollars spent in aid to the allies could have been used in concrete policies for economic and social development in their own country.

Moreover, cheap international capital that could be transferred to Venezuela to feed productive investments shifted to other Latin America neighbors. The international capital was treated as an enemy and transaction costs to do business and create jobs became unsustainable. The inefficiency lead to increasing cost of life and inflation soared, reaching 32% in 2012. Growth rates of Venezuelan GDP remained among the lowest in Latin America over the last five years and the future perspectives are still hazy given the lack of investments in strategic areas and qualified human resources (1).

Despite the favorable international conjuncture, as the past decade, many opportunities were lost in the country during the three governments of Hugo Chávez. And the poor Venezuelans, to venerate his populist speech, exchanged their entitlement of birthright for a mess of pottage.

Health Indicators 

Health conditions in Venezuela stagnated over the past decade relatively to other countries in the region. The data below, based on the World Bank development indicators (2), shows how Venezuela stayed behind compared to some countries of similar level of development, with regard to some Millennium Development Goals (MDGs) health indicators. Maternal mortality rates in Venezuela stagnated in the period 1990-2010, while it decreased in Brazil, Chile, Colombia, Peru and Mexico. In 2010, Venezuela was carrying the highest maternal mortality rate among this group of countries (Chart 1). Peru and Colombia, who presented higher maternal mortality rates than Venezuela prior to Chavez consecutive turns, had made ​​significant progress during the last two decades leading their citizens to a better situation than the Bolivarian neighbor's in 2010.


High levels of teenage pregnancy over Chávez’s government corroborated with the maintenance of elevated rates of maternal mortality in the country. In 2008, Venezuela suffered the highest rates of teenage fertility (15 to 19 years old) among the group of countries analyzed (Chart 2). Countries like Colombia, with worse teenage pregnancy than Venezuela in the beginning of Chavez’s government had significantly better results in 2008.


It is worth mentioning that between 1990-2 and 2004-6, the percentage of the Venezuelan population consuming less than the acceptable minimum level of dietary energy increased from 10% to 12% (MDG indicator 1.9). Countries such as Mexico and Chile already had ratios below 5% regarding this indicator in 2006 and Brazil, Peru and Colombia, showed reductions from 10% to 6%, from 28% to 13% and from 15% to 10%, in the same period, respectively. Vaccination rates in Venezuela stayed behind all the countries analyzed. In 2008, neonatal tetanus vaccination rate for pregnant women was only 50%, compared with 92%, 86%, 83% and 87% in Brazil, Chile, Peru and Mexico, respectively. Regarding DPT3, used to immunize children less than one year against diphtheria, pertussis and tetanus, the rates were 83%, compared with 99%, 96%, 93% and 89% in other four countries, respectively.

Measles vaccination rates in 2008 for this set of countries displayed the same pattern regarding previously analyzed vaccines: 83% in Venezuela compared with 99%, 96%, 91% and 95% in Brazil, Chile, Peru and Mexico respectively. This poor performance led Venezuela to be one of the few countries where incidence of measles among children increased in the past decade, situation considered unacceptable for any public health policy.

Infant mortality rates in Venezuela, in the past decade were reduced on 25% - almost the same behavior performed by Chile. However, the rates of infant mortality in Venezuela are more than double that of Chile in 2008, which reached 8.5 per 1000 live births. Nevertheless, this reduction was not comparable to the 39%, 47% and 35% observed in Brazil, Peru and Mexico, respectively. Besides measles, many other diseases are bringing problems to Venezuela. Chart 3 shows the rates of tuberculosis incidence in selected countries between 1998 and 2008.


It is clear that, while significant progress has occurred in Brazil, Mexico, Chile and Colombia in the fight against tuberculosis, in Venezuela the incidence rates remained virtually the same between 1998 and 2008 (around 32-33 per 100 000 inhabitants). And the situation will only get worse, given that among all these countries, Venezuela is the one with the lowest detection rate of new TB cases (around 64%) compared with 91%, 79% and 100% in Brazil, Chile and Mexico, respectively.

Health and Violence

Besides the deterioration of public health, the confrontation policy encouraged by Chávez increased class struggles and encouraged the poor to seek a reckoning veiled. Militarization and encouragement of a gun culture was explicit, through the creation of the Bolivarian Militias who followed the same steps of Defense Committees deployed by Fidel Castro at the beginning of the Cuban Revolution. Under the aegis of The People in Arms slogan, the government trained 120 thousand civilians in the use of heavy weapons, creating a parallel organization to protect the people against the International Imperialism. According the Brazilian Epoca Magazine story (1), there are over one thousands of these armed battalions under these conditions and it is difficult to prevent heavy weapons from falling into the hands of criminals or drug traffickers.

Data from United Nations Office for Drugs and Crime - UNODC (3 ) show a rapid increase in crime rates during the last ten years - reverse the trend that has occurred in other countries with high rates of violence, such as Colombia and Brazil (see chart 4). However, information from national human rights organizations claims that homicide rates have tripled over the Chavez’ governments. The impact of violence on the health of Venezuelans had increased in alarming proportions and it must go far beyond the health policies to try to solve them.


Final Remarks

Much of the health policy failures during the Chávez government lies in the neglect of public health strategies and in the raise of a welfare policy that served for political purposes. The first Bolivarian government in 1998 promulgated a new constitution that guarantees to the Venezuelans a health system organized by the State, free of charge for all, providing comprehensive care that seek to attack both biological and social determinants. The organization of services would be decentralized to states and municipalities and community participation would be ensured in the services administration, integrating health teams with communities, families and individuals.

It resembles the proposed health charter at the Brazilian Constitution of 1988. However, the reality was far from what happened in Brazil. The key changes in the Venezuelan health system should occur within the framework of the Strategic Plan Salud y Desarrollo Social (PES) 2000-2006. This Plan had been placed as the axis of the changes in the primary care health system and it is intended mostly to tackle the needs of the vulnerable groups of the population. However, between 2000 and 2003, this plan was not implemented followed by complaints and the population made clear their dissatisfaction with the emptiness of health policies in the country.

Thus, in February 2003, the City of Caracas (guided by the national government) has contacted the Embassy of Cuba to request a Cuban Medical Mission to the country, which landed in the city in April of the same year. This contact initiated the Plan Barrio Adentro, which in December 2003 was extended to the entire national territory and, by presidential decree, became a Social Permanent Mission. It was the birth of a parallel health system, not integrated in terms of technical and administrative services with the Ministry of Health.
The political bases of Chavez applauded, in early 2004, Las Misiones Barrio Adentro (MBA), but already in 2007, according to the Medical College of Venezuela, the satisfaction levels of the MBA users fell 27% compared to 2004 ( 4). Many claim that the MBA program had as its main objective to transfer oil to Cuba, as compensation for the services of Cuban health professionals, including doctors. In this sense, despite counting with unlimited (and not transparent) fiscal resources, the system only achieved coverage of 17% of the Venezuelan population by 2008.

The program had been recognized as a failure by authorities like the Chairman of the Metropolitan Medical College and the President of the Bolivarian Society of Integral Medicine. The failures relate not only to their physical goals (less than half the 8500 primary health units proposed at the beginning of the program had not been built on schedule until 2008). Many of the health units built remain empty of physicians and medical supplies. In 2008 the Program had only one doctor for every 3000 inhabitants, when the target was 1 to 1200.

Many claim that the MBA program did not comply with the purposes of promotion and prevention for which it was created. It lacks the basic supplies such as vaccines and medicines. Despite the affection received by the population for those doctors and health teams visiting the households, the effectiveness of care ended up being very low. Moreover, Cuban doctors were unprepared to meet the health needs of a population with a profile of health risks far more complex than what exists on the Island. The mixed risk factors' framework combining communicable diseases, chronic diseases and violence is too complex for the Cuban doctors' expertise, especially because Venezuela still have a disabled and outdated epidemiological information system.


NOTES

(1) See Gorczeski, V and Coronato, M., The Lost Age of Venezuela , Revista Época, São Paulo, March 11, 2013.

(2) World Bank, World Development Indicators, electronic version on http://www.worldbank.org .

(3) UNODC 2011 Global Study on Homicide: Trends, Context and Data, UNODC, New York, 2012.

(4) Medical Federation of Venezuela, LXIII Reunión Ordinaria de la Asembléa, Diagnostico del Sector Salud en Venezuela: Estudio de las Enfermedades Emergentes y Reemergentes , Punto Fijo-Edo. Falcon, del 27 al 31 Octubre del 2008.

Saturday, January 15, 2011

Demographic Patterns in Rwanda at War: Part 2 - Impacts on the Use of Contraceptive Methods, Infant, Child and Maternal Mortality, Orphanhood and Migration

Andre Medici
Adriana Correa Alves

Prolonged armed conflicts could reduce the supply of contraceptive methods changing the established behavior of couples and unmarried women into use them. Contraceptive methods prevalence among married women in Rwanda was higher in 1992 than in 2005. The Rwanda’s armed conflict reduced the access to contraceptive methods. The proportion of married women with access to modern contraceptive methods felt from 13 to 4 percent between 1992 and 2000, increasing to 10% in 2005.


In 2005 traditional contraceptive methods were used by 7% of married couples in Rwanda and 10% used modern contraceptive methods. Among the sexually active unmarried women, the proportion using contraceptive methods reduced in the post war context. The rate of condom use, for example, which was 11 percent in 2000, has dropped to 4 percent in the 2005, according the Demographic and Health Surveys (DHS).


In the last two decades, maternal mortality and infant mortality reduction gained wider attention and urgency in developing countries, as two of the Millennium Development Goals. However, armed conflicts challenge maternal and child mortality reduction, because reduce the availability of prevention and curative health care services and food supply and nutrition programs for children. It also increases chronically stress motherhood, causing difficulties in coping with the multiple needs of young children.

Ghobarah, Huth and Russett (2003) found that health care systems suffer long term damage on account of conflicts, with a strong impact on increasing infant and child mortality rates. The results from the Rwanda DHS 1992, 2000, 2005 allow to draw infant and under-five mortality trends during the period before and after genocide. Between 1992 and 2000, infant mortality rates per 1,000 live births jump from 85 to 107, decreasing to 86 in 2005.

The data suggests that immediately after the genocide occurred a marked deterioration in infant and child health. Between 1992 and 2000 Rwanda experienced a sharp increase in both infant and under-five mortality rates but the 2005 data indicates that these rates have declined and returned to the levels as 1992. In conclusion, infant and child mortality trends reverted and begun to improve in the past ten years.

Maternal mortality, defined as women deaths occurred during pregnancy, childbirth, or within 42 days of the termination of the pregnancy, remained high in Rwanda during past decade. In 2005, the maternal mortality rate was about 750 deaths for every 100,000 live births. This total has declined considerably since the end of the war when maternal mortality rate were estimate in 1,071 per 1000 live births between 1995 and 1999. According to UNFPA (2003), for every woman who dies as a result of pregnancy, some 30 surviving women experience lasting morbidities as a result of pregnancy complications, including anemia, infertility, pelvic pain, incontinence and obstetric fistula.

Many of the conditions that result in maternal mortality could be treated or managed safely with proper care. However, women in developing countries often give birth without any skilled medical care, and emergency obstetric services are rare. The war accounted for much of the lack of adequate prenatal and delivery services in the Rwanda case.

Hundred thousands of adults killed during the war and high rates of maternal mortality generated one of the most devastating impacts of the armed conflict in Rwanda: the dramatic increase in the number of children orphaned. Without their families as primary safety net, orphan children are at increased risk of violence, exploitation, and other forms of abuse when deprived of the protection of adults.


According DHS 2005, 21% of children under age 18 in Rwanda had lost one or both of the parents. As a consequence of the war, the proportion of children who have lost their parents in 2005 increased significantly with the age of the child: (2 percent at age 0 to 1 year; 6 percent at age 2 to 4 years and 16 percent at age 5 to 9 years). The higher rates of orphanhood were found at teens aged between 10 and 14 (36 percent) and 15 to 17 (41 percent) due to the effects of the 1994 genocide.

The 2005 DHS data also allows observing that the parental survival status influences school attendance of children aged 10-14 years old. When both parents are alive and children live with at least one parent, 91 percent attend school. In contrast, this proportion drops to 75 percent when both parents are deceased. Even so, as observed, girls in both situations are able to attend school in higher proportion than men.

From the early nineties and during the 1994 conflict many Rwandans abandoned their homes and their lands, fleeing internal conflict and civil war. While some fled across Uganda, Congo, Burundi and Tanzania borders, and even sometimes toward more distant countries, others remained in Rwanda seeking refuge in those provinces and municipalities. Many Rwandans who fled the armed conflict received international aid in refugee camps and were eventually repatriated under the auspices of the United Nations.

The population of Rwanda is composed in its majority by native (non migrants). These constitute, indeed, 80% of the total population against 20% of migrating people. It is possible to identify important variations of migration proportions between the administrative areas. Thus, the city of Kigali, the province of Umutara, Kibungo and Kigali count with a high proportion of migrants.


The population of the city of Kigali is formed of 64% of migrants. This percentage of migrants explains itself by the role of the city status as country capital and the consequent economic advantages with facilitates de search for jobs and social infrastructure, such as health and education facilities. In addition to the economic and social reasons, it is important to add that migrants often chose to get settled in Kigali for reasons of security or anonymity.

The province of Umutara, comes in second position as recipient of migrants. Half of its population declared to have lived elsewhere earlier. The raising proportion of migrants in this province is because it was constituted as a welcome site for the repatriated population after the process of pacification. The province of Umutara had welcomed an important number of refugees from Uganda and Tanzania.

In 1994, approximately two million Hutu refugees, most of whom suffered the consequences of the genocide and feared Tutsi retribution, fled to neighboring Burundi, Tanzania, Uganda, and Zaire (now the Democratic Republic of Congo). Many of them died for epidemics of cholera and dysentery which swept the refugee camps. It was the faster and most important displacement of populations of the contemporary African history.

After the conflict end (1996) started a return migration movement to the country. This movement was as fast as the one of the departure during the conflict. The number of former refugees who went back to Rwanda between 1994 and 1997 is estimated in 800 thousands.

The exam of the migratory status according to the area of residence shows important disparities. The migrating population constitutes more of 47% of the population of the country urban. In rural areas immigrant only constitute 14% of the population.


As can be seen by figures, the men predominate in the migratory fluxes toward the urban areas whereas the women are more numerous among the rural migration. In 2005, less than 5% of total inhabitants were born abroad Rwanda and hardly 2% declared to have resided earlier abroad. The most relevant countries contributing to international immigration to Rwanda are Democratic Republic of Congo, Burundi, Uganda, Tanzania and Kenya. The majority of international immigrants are decedents of former refuges who have been repatriated especially from neighboring countries after the 1994 war and genocide in Rwanda.

Sunday, November 7, 2010

Demographic Patterns in Rwanda at War: Part 1 - Impacts on Population Size, Gender Imbalance, Fertility and Marital Status

Andre Medici
Adriana Correa Alves


Rwanda was the scenario of one of the bloodiest armed conflicts in the modern African history. From April to July of 1994 an episode of ethnic violence between the Hutu and the Tutsi ethnical groups killed more than one million people (mainly Tutsis and moderate Hutus) in only about 100 days causing massive displacement (about 2 million people) to neighboring countries. The war and genocide took significant impact on the population structure and economy. The genocide responded to about 150,000 widows and 300,000 abandoned children. Rape and HIV infection increased in large proportions. The United Nations estimates that at least 250,000 women were raped during the genocide and a large number of those women were subsequently executed.

Although Rwanda suffered a major loss of human life during the genocide, the population size after the war remained essentially the same because over a million former refugees who were living for years in exile returned at the end of the war. Currently, Rwanda’s population structure is more stable with less displacement. People were settling fast and many are already reintegrated into the social and economic life while peace and security has been progressively assured. Many health facilities were destroyed during the genocide and even some units not affected by the conflict became without adequate staffing and equipment.

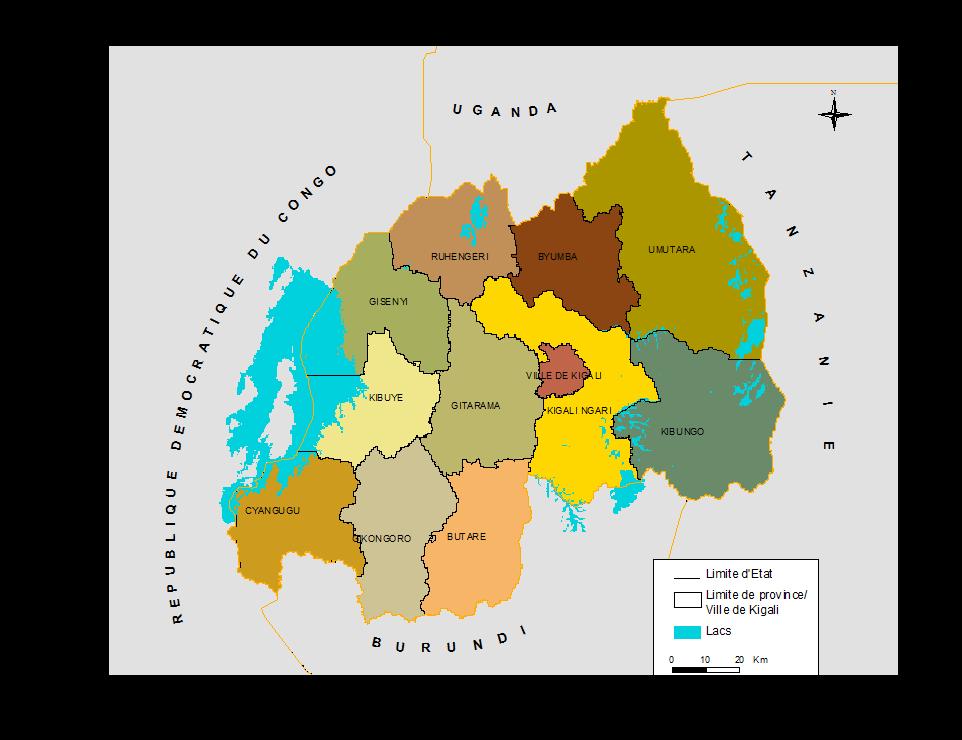
The demographic census data shows that Rwanda reached a population of 8.128,553 people in 2002 and 83% of this population was living in the rural areas. The urbanization increased substantially between 1978 and 2002. Estimated in 3.6% in 1978, the urbanization rate reached 6% in 1991 and 17% in 2002. Part of Rwanda’s population is concentrated in the capital Kigali, with 603.049 habitants in 2002 representing 44% of the country urban population. After the administrative reform of 2000 Rwanda counts with a total of 11 Provinces and the city of Kigali (see map).

Rwanda has the highest population density in Sub Saharan Africa, estimated in 321 inhabitants per square kilometer in 2002. The population is essentially young, with 67 percent of all Rwandans under the age of 20. Poverty remains a major barrier to development in Rwanda. Currently 60% of the population is below the poverty line and the poverty rates increased in the last 30 years.


The consequences of armed conflict in the size, composition and dynamics of the population are difficult to quantify. Armed conflicts often disrupt the vital statistical systems, the statistical offices and the possibilities to conduct censuses and household surveys. As a result, good and reliable data during the wartime years are usually unavailable for most countries affected by armed conflicts.

In order to present evidences about the demographic impacts of the Rwanda’s war we accessed a mix of official data sources, research findings and administrative records. Some data sources such as the Rwanda Demographic and Health Survey (DHS) and the National Census 2002 provide more robust demographic information. Demographic trends were built by pooling the DHS data in three moments: 1992, 2000 and 2005. The data sets covered a sample of 6,551, 10,421 and 11,321 women in the age group 15-49 years in each of these years, respectively. Details on the survey procedures and sampling design are available in individual survey reports.

The population structure by gender and age is crucial to the demographic and socio-economic analysis related with post-conflict contexts. During the 1994 war, most of deaths were concentrated in men and boys feeding the current Rwanda’s gender imbalance. The war led to an over proportion of females in all provinces, excepting Kigali city, where women represent only 46% of the population.

Figure 1 shows the Rwanda’s population distribution by age and gender in 2002. This demographic pyramid reflects the age and gender structure six years after the war. It has a very large basis and numerous irregularities in the demographic structure in several age groups as consequence of the war.

Figure 1
Rwanda Population Pyramid 2002


The pyramid base narrows rapidly as it reaches the upper age limits, indicating that fertility rates increased after the war and genocide. In 2002 the total fertility rate was estimated in 4.1 children per women in reproductive age. It indicates a resumption of previous procreation patterns following the reconstitution of the families and new unions’ formation. However, general mortality is still high. The total mortality rate in 2002 was estimated in 154 deaths per thousand inhabitants.

It is important to observe an unexpected irregularity in the number of children in some specific ages such as one, three and four years old. It could be attributable to an-over mortality lead by malnutrition and transmissible diseases in some bad years due to waves of famine and epidemics in the post-war context.

There is a significant population fall-off in the ages between 6 and 12 years old, indicating that the generation born in the war period (1990-1996) was affected by an over mortality (probably due violence and the lack of water, sanitation, nutrition and health care) and by the decrease in the fertility rates following the separation of the couples during the war. On the other hand, the disproportionately increase in the population between 11 and 20 years old is associated with the massive return of refugees which were sheltered in other countries during the wartime.

The huge gender imbalance produced by the war could also be observed in all ages at the demographic pyramid, but more extensively among the populations over 45 years old with an excess of women due the over-mortality of men during the war.

The sex ratio (measured as the proportion of men per women) is an indicator to evaluate the demographic balance between males and females. According this indicator Rwanda had 91 men for 100 women in 2002, mostly due by the effects of war and genocide. In urban areas the proportion of men is higher, but the inverse is observed in rural areas where the ratio reached 87.5 men per 100 women in 2002. The urban/rural differences in the sex ratio resulted mostly from the farming exodus of the mainly masculine populations in search of education and job opportunities in the cities, sometimes hopeless, contributing to inflate the urban poverty .

At the provincial level, sex ratios in 2002 oscillated between 87.1, in the Province of Kibuye, and 93.3, in Umutara. Inversely, in urban areas as the city of Kigali, where the male population is predominant, the sex ratio reached 117.5 in 2002.

Figure 2 represents the sex ratio at national level by residence - urban and rural - and age. The total sex ratio is bellow 100 in all age groups of 20 years old and more. This reflects the impact of war and genocide in 1994 that caused higher levels of male mortality in adult ages and mass emigration of males to neighbor’s countries.

Figure 2
Sex Ratio according age groups and residence area - Rwanda 2002


On the other hand, in urban areas the sex rate reaches an over proportion of males between the ages 20 and 60, as result to a massive demand for job opportunities by the male population.

Fertility in Rwanda plays an important role on population growth. Socio cultural values, mostly linked with conservative interests defend a pro-natality attitude. The data from DHS 2005 shows that the total fertility rate (TFR) among Rwandan women remains very high: 6.1 children for women in reproductive age, 4.9 in urban areas and 6.3 in rural areas. Data also shows that after the war context, between 2000 and 2005, TFR increased from 5.8 to 6.1 (figure 3) breaking a historic context of fertility decreasing experienced since the early eights.

Figure 3
Total Fertility Rates in Rwanda: 1983-2005


Existing literature explores the hypothesis of fertility decline during periods of armed conflicts, but does not discuss what happens after the conflict. As can be shown, the TFR in Rwanda was reduced during the war period (from 6.2 in 1992 to 5.8 in 2000), increasing again in the after-war period, when TFR returns to 6.1 in 2005. The analysis of the age specific fertility rates in 1992, 2000 and 2005 (Figure 4) demonstrates a similar pattern of the fertility rate: a decrease of the TFR in the ages between 25 and 39 during the period 1992/2000 and a return to an increase pattern, between 2000 and 2005, for the same age groups. So, armed conflicts lead to a fertility decline during the conflict time and to a fertility increase after the conflict. Even so, figure 6 shows a persistent decline in the fertility in the youngest (15-19) and oldest (40-49) age groups between 1992 and 2005.

Figure 4
Total Fertility Rate in Rwanda by Women Age: 1983-2005


Another interpretation to the present high fertility rates in Rwanda is associated with the persistent unwanted fertility in this country. Women in developing countries often have more children than they desire. A birth is considered “wanted” if the number of living children at the time of conception of the birth is less than the ideal number of children, as reported by the respondent. Bongaarts (1997) argues that unwanted fertility is typically higher in countries at intermediate levels of their fertility transition.

The Total Wanted Fertility Rate is the same as the Total Fertility Rate, only if unwanted births are omitted. If all unwanted births were avoided by the adequated supplies of contraceptive means for Rwanda's women in reproductive age, the TFR for Rwandan women should be 4.6 children in 2005, rather than 6.1 children. The TWFR is higher in rural areas (4.8) than in urban areas (3.6) and in the City of Kigali (3.4).

However, the data about the unwanted fertility in 1992 (before the war) is not available. If considered that the access to family planning was better in 1992 than it is in the present, probably the unwanted fertility in 1992 should be lower than in 2005. Rwanda has the second higher TFR among 12 sub-Saharan countries in which a DHS survey has been conducted since 2000. But if the reduction of the TFR between 1992 and 2005 had kept the same pattern observed between 1983 and 1992 the Rwanda's TFR probably would reach 4.6 in 2005, standing among the lowest levels in the Sub-Saharan Region on the early 2000’s. Based on that, certainly the armed conflict has an important role in the delay of fertility rate reduction in Rwanda.

Figure 5
Total Fertility Rates in 12 Sub-saharan African Countries in the Early 2000's


The age at which childbearing begins is an important demographic indicator because it has a direct effect on a women’s cumulative fertility, particularly when contraceptive means are not available. The younger a woman is when she begins childbearing, the greater her likelihood of having many children. At the same time, having children at too young an age can have negative repercussions on the mother’s health and can put her children at risk of dying. In Rwanda, in 2005, the median age at first birth of 22.0 years for women age 25 to 49 is identical to the median age observed for women the same age in the 2000.

Another important fertility indicator is the age of marriage for women. In low income countries, the women who marry earlier tend to have their first child earlier and give birth to more children, contributing to higher fertility rates. The duration of exposure to the risk of pregnancy depends primarily on the age at which women first marry. In Rwanda, where pre-marital fertility is uncommon or very low and the efforts to control fertility are not expressive, delays in marriage can cause a reduction in the number of women under risk of childbearing. The average age at first union is 20.7 years and first sexual relation is 20.3 years, which is relatively late compared with other African countries and has remained unchanged since 1992, when the median age at first union was around 20 years. On the other hand, men in Rwanda tend to marry at an older age than women. The median age for the first marriage is 25.0 years and the median age of first sex is 20.8 years. Even having the first marriage and first sexual relation later than other developing countries, Rwanda presents high fertility rates due the little space between pregnancy and the lack of contraceptive goods and services to the poor families.

Marriage remains practically the sole context of procreation in Rwanda. Among the women age group 15-49, 49 percent declared they were in a union at the time of the 2005 DHS. The proportion of never-married women decreases as age increases and it is rare to find a woman over 45 years old who has never been married (2 percent). In addition, 12 percent of Rwandan women live in polygamous households. Rwandan women tend to marry late: only 19 percent of those between the ages of 25 and 49 had married before they were 18 years old.

Of the 11,321 women surveyed in 2005 by DHS, 49 percent were in union (29 percent formal marriages and 20 percent in informal unions). The proportion of women who never married is 38 percent. Divorced women make up only 0.9 percent of women, separated women make up 9 percent, and widows are 4 percent. The proportion of never-married women has increased since the RDHS-II, from 34 percent to 38 percent.

Apparently the war does not present a strong impact in the marital status of women. The largest increase occurred in the 15 to 19 age group, of whom 90 percent were never married in 1992, 93 percent in 2000, and 97 percent in 2005 showing the trend to increase the first marriage age mentioned before. The number of married women has remained relatively stable during the last two surveys. The proportion of widowed women has dropped by half, from 8 percent in 2000 to 4 percent in 2005, given that the 2000 data was inflated by the armed conflict effect on the men’s disproportional mortality.

The second part of this article (to be published in the next post) will address the impacts of the Rwanda armed conflict in the use of contraceptive methods, infant, child and maternal mortality, orphanhood and migration.

Sunday, August 15, 2010

Armed Conflicts and Demographic Transition in Developing World:

Andre Medici
Adriana Correa Alves (1)


Introduction

In the last twenty years armed conflicts intensified in many of the poorest areas in the world, with severe consequences in mortality, human displacement, famine, destruction of public infrastructure and losses of physical and social capital. Armed conflicts reverse the benefits of the development process. Their devastating economic and social consequences are deep, remaining for years after the end of the conflict.

Many armed conflicts are associated with demographic imbalances. In fact, the persistency of high fertility rates, the rise of youth population, chaotic urbanization and migration processes, beside the scarcity of natural resources as cropland and freshwater supply, are frequently associated with the origins of civil wars in low income regions.

Armed conflicts generate direct consequences in mortality due war violence. All the three demographic dynamic components – mortality, fertility and migration – could be affected by armed conflicts and civil wars. Mortality in all age groups increases due direct human losses by the conflicts. Even affecting all age-groups, direct mortality in the conflicts is higher among adolescents and young adult male population. As consequence, armed conflicts multiply the number of orphans and widows, creating life disruption and increasing poverty among the survivors, especially women and children.

On the other hand, armed conflicts have also indirect impacts in mortality and morbidity accelerated by the increasing malnutrition, the disruption of family structures and family support to youth and children and the destruction of farmlands and public infrastructure. Health services, water supply and epidemiological surveillance generally don’t work properly during armed conflicts times. Increasing morbidity is one of the biggest consequences of civil wars and it is associated with the higher incidence of transmissible diseases such as AIDS and malaria during the conflicts and in post-conflicts contexts. The burden of diseases increases as consequence of the rising of physical disabilities and chronic diseases, especially those associated with stress and mental disorders.

Fertility generally increases as result of lack of access to family planning and other factors as rape and sexual violence against women. Some authors associate increases in fertility during and post-conflict with the women’s will to compensate the loss of children due to the war, but this argument still needs evidence to be proved.

International and internal migration intensifies due the generation of large waves of war refugees affecting family arrangements and family composition. In areas where displaced population is accommodated in refugees’ camps, family structure is disrupted because these camps are organized according gender and age groups. Family members are separated and children are not allowed to live with their parents. Age structure and gender ratios also change and turn imbalanced, due to disproportionately mortality of men and youth/adults. Men and women also may be differentially affected by the challenges and opportunity to reorganize their lives, to find households and to reinsert themselves into social networks and economic activities in the aftermath of armed conflicts.

Women and children suffer the most. Gender specific consequences include increased gender ratios, female-headed households, changes on the fertility patterns and unmet needs of reproductive health programs due the disruption of health systems and destruction of health facilities. Women often become caregivers for injured combatants and find themselves, as a result of conflict, unexpectedly cast as sole manager of a household, sole parent, and caretaker of elderly relatives. Children, especially the orphans, miss opportunities to attend school and health programs. Women and children are easy targets to sexual and gender-based violence and exploitation to the point of depression, mental illness and suicide. Women are disproportionately vulnerable to war associated risks such as human trafficking, forced labor or slavery, HIV/AIDS and other SDT and lack of access to education and health care. The violent environment during the conflict and post-conflict contexts reduces access or eliminate health information and health services, especially in outlying areas.

Demographic transition: balance and trends

Although the demographic transition is accelerating in most developing contexts, in low income regions, such as Sub-Saharan Africa, fertility and mortality are still high. Since the 1960s, population programs, especially those financed by international organizations or bilateral technical cooperation, have played a significant role in enabling couples to choose smaller families and to reduce fertility. However, armed conflicts could stop the spectrum of collaboration between these programs and the governments, slowing the gains in fertility reduction. In addition, two thirds of children in many Sub-Saharan African countries are projected to have HIV infection by the time they have reached age 50 (or die from HIV before).

The demographic transition is a generic concept associated with demographic changes from a context of high mortality and fertility rates to another of low mortality and fertility rates. Historically, the first classic demographic transition refers to the declines in mortality and fertility, as witnessed from the XVIII Century onward in several European populations, and continuing at present in most developing countries. The final stage of the first demographic transition was supposed to be an older stationary and stable population corresponding with replacement fertility (i.e. just over 2 children on average), zero population growth, and life expectancies higher than 70 years. The European demographic transition process was accelerated by the immigration. European countries intensively exported population to the Americas and other regions between the second half of XIX century and the first half of the XX century.

A new concept introduced by R. Lesthaeghe (2002) and others (2) in developed countries is the second demographic transition (SDT). The traditional concept implies that, at the end of the first demographic transition process, would be in place an ultimate balance between deaths and births and no “demographic” need for sustained immigration. The second demographic transition, on the other hand, sees no such equilibrium as the end-point. New social behaviors and changes in cultural norms bring new patterns such as a multitude of living arrangements other than marriage and the disconnection between marriage and procreation. These new social behaviors lead the fertility to sub-replacement levels and consequently to a no stationary population.

Instead, populations would face declining sizes if not complemented by new migrants (i.e. “replacement migration”), and they will also be much older than envisaged by the first demographic transition as a result of lower fertility and additional gains in longevity. Migration streams will not be capable of stemming aging, but only stabilize population sizes. Nonetheless, the outcome is still the further growth of “multicultural societies.” On the other hand, the SDT brings new social challenges, including those associated with further aging, integration of immigrants, less stability in family arrangements and high levels of poverty or exclusion among certain household types (e.g. single persons of all ages, lone mothers and illegal immigrants).

The demographic transition process tends to be much faster in developing countries. In Latin America, improvements in preventive health and medical care in recent decades lead to a fast to infant mortality reduction and increased life expectancy. Fertility has also declined faster, resulting in a quick transition from unprecedented population growth to low birth rates. Migration (both national and international) also affects the demographic transition in Latin American Countries. Colombian migrants, expulsed by the guerrillas, went to Amazon areas of Brazil and Salvadorians went to Guatemala, Honduras and Belize as consequence of armed conflicts.

One of the principal criticisms of the demographic transition concept is the questionable applicability to developing regions such as Africa, where the prerequisites for wealth, governance and information access to reduce both mortality and fertility are limited, especially in war and post-conflict contexts. The creation of good governance and sustainable economic growth, with increased provision of social rights as health, education, good jobs and social welfare, could pave the road to a stable process of demographic transition in these regions.


Armed conflicts and Demographic Dynamics: a brief literature review

The empirical literature on conflict and demography is scarce. Despite the relevance of the impact of armed conflicts on demography dynamic in poorest countries, especially due high mortality and forced migration, this subject is a new field of study (3). There is little structured analysis about the consequences of armed conflicts in the demographic patterns and most of the conclusions are anecdotic and could not be generalized. In most cases it is hard to found general patterns. Most of the consequences depend on the interaction between economic, social, cultural and political variables existing before, during and after the conflicts.

Conflict and violence have been referred as one of the principal causes for the erosion of physical, social and human capital in many countries. In a recent search for evidence about the demographic consequences of armed conflicts, Randall (4) analyzing the post-conflict demography of the Malaian-Tuareg, found mixed evidence of the effects of war on reproduction, mortality and family arrangements in three different stages: disorder, limbo and new order. Each one of the three phases has particular complexities and the armed conflicts could work as a catalyst to generate demographic change or to accelerate previously established demographic trends. The different escalation processes presented by the author’s framework serve to identify the related degrees of a conflict’s development and the peculiar forms of involvement by those experiencing the conflict.

The disorder takes place at the beginning of the conflict and may include violence and displacement according different environments. In the disorder phase could be observed biological and psychological impacts of the conflicts such as nutritional crisis, emergence of diseases, social stress, increased infant mortality and curtailed breast-feeding. The fertility and nuptiality tend to fall as a result of spousal separation, lack of privacy, abortion and reduced fertility due to under nutrition. The risk of rape also tends to increase.

During the limbo stage, that happens when conflict is established, people have no clear direction for the future. The population has few opportunities for sustainable self-reliance and generally suffers economic restriction and basic logistic problems associated with food distribution, security, health care and sanitation. This phase can last for several years and entire generations can grow up and matured under these uncertain conditions. In the third stage named new order, which take place during the post-conflict reconstruction, the main characteristic is the re-establishment of social and political order and the restoring of the semblance of normal life. The new order does not represent necessarily a return to the past patterns but generates an entirely new social, economic and demography dynamic.

Verwimp and Van Bavel (5) explain the cumulated fertility of Rwanda women and the survival of their children during and after the conflict through the theory of risk insurance or old-age security approach of reproductive behavior. This theory implies that fertility rises among refugee women as a response to lower chances of surviving. The refugees compensate the loss of children by having more children. Such behavior was particularly observed among the Palestinian population under armed conflicts by decades, where fertility is substantially higher than would be expected from their level of socio-economic development, according DellaPergola (6).

Girls’ survival in the first life-year is naturally bigger than boys’ survival in regular demographic contexts, but in armed conflicts areas the newborn boys have more chances of surviving than girls due family behavior and social norms. During armed conflicts boys are valued because they are early incorporated to fight as soldiers. Other social norms could also explain the over-value of boys by families. In many African countries, as Rwanda, only boys are heirs of land property. Families composed by girls have the risk to lose land property and access to food and water sources in the future.

Avogo and Agadjanian (7) explore the influence of the end of war and the postwar rebound in Angola’s fertility patterns. They show that the impact depends on the degree of exposure to the war and also the women’s socio-economic status. Ghobarah, Huth and Russett (8) analyzed several cross national World Health Organization dataset on 23 major diseases in population distinguished by gender and age groups and they found evidences that civil war increases the risk of death and disability through the breakdown of norms and practices of social order. The study also found that if a neighboring country recently experienced a civil war, women and girls are disproportionately affected by disability and death from AIDS.

In Latin America, where societies count on higher income and governance levels among other development regions, the existing literature shows that armed conflicts have impacted less the demographic trends and women and girls than in Africa. In Central-American Countries as Guatemala, Honduras and El Salvador, armed conflicts triggered intense migration flows and had demographic impacts such as delays in the reduction of fertility rates. For example, in the wake of the ensuing Honduran agrarian reform, in which only native Hondurans were allowed to own land, as many as 130,000 Salvadorans were forced to give up whatever jobs or land they had acquired and return to El Salvador. The exodus of Salvadorans from Honduras contributed to the so-called "Football War" between these two countries, in 1969, and the large number of returning Salvadorans worsened social and economic tensions within El Salvador itself.

In the next edition of this blog we will discuss some examples about how armed conflicts had affected demographic and health trends in some developing countries.

Notes

(1) Adriana Correa Alves is a Consultant of the Inter-American Development Bank and hold a PhD in Humans Right in Salamanca University (Spain).
(2) Lesthaegue, R., (2002) Second Demographic Transition, Vrije Universiteit Brussel (VUB).
(3) Brunborg, H., and E. Tabeau, (2005), Demography of Conflict and Violence: An Emerging Field, European Journal of Population, 21: 131–144.
(4) Randall S. (2005), Demographic Consequences of Conflict, Exile and Repatriation: a Case Study of Malian Tuareg. European Journal of Population 21: 291-320.
(5) Verwimp P. and Van Bavel J V (2005), Child Survival and Fertility on Refugees in Rwanda after the Genocide. European Journal of Population (2005) 21:271-290.
(6) DellaPergola, S. (2001). Demography in Israel/Palestine: Trends, Prospects, Policy Implications. Paper presented at IUSSP General Conference. Salvador, Brazil.
(7) Avogo W. and Agadjanian V. (2007). Reproduction in crisis: war, migration and fertility in Angola. A paper presented at the Population Association of America 2007 Annual Meeting Program. March 29-31, 2007, New York.
(8) Ghobarah, H. P. Huth and B. Russett (2003). Civil war kill and main people – Long term after the shooting stops. American Political Science review, 97(2), 189-202