Showing posts with label Health and Demography; Armed Conflicts and Demography. Show all posts

Saturday, January 15, 2011

Demographic Patterns in Rwanda at War: Part 2 - Impacts on the Use of Contraceptive Methods, Infant, Child and Maternal Mortality, Orphanhood and Migration

Andre Medici
Adriana Correa Alves

Prolonged armed conflicts could reduce the supply of contraceptive methods changing the established behavior of couples and unmarried women into use them. Contraceptive methods prevalence among married women in Rwanda was higher in 1992 than in 2005. The Rwanda’s armed conflict reduced the access to contraceptive methods. The proportion of married women with access to modern contraceptive methods felt from 13 to 4 percent between 1992 and 2000, increasing to 10% in 2005.


In 2005 traditional contraceptive methods were used by 7% of married couples in Rwanda and 10% used modern contraceptive methods. Among the sexually active unmarried women, the proportion using contraceptive methods reduced in the post war context. The rate of condom use, for example, which was 11 percent in 2000, has dropped to 4 percent in the 2005, according the Demographic and Health Surveys (DHS).


In the last two decades, maternal mortality and infant mortality reduction gained wider attention and urgency in developing countries, as two of the Millennium Development Goals. However, armed conflicts challenge maternal and child mortality reduction, because reduce the availability of prevention and curative health care services and food supply and nutrition programs for children. It also increases chronically stress motherhood, causing difficulties in coping with the multiple needs of young children.

Ghobarah, Huth and Russett (2003) found that health care systems suffer long term damage on account of conflicts, with a strong impact on increasing infant and child mortality rates. The results from the Rwanda DHS 1992, 2000, 2005 allow to draw infant and under-five mortality trends during the period before and after genocide. Between 1992 and 2000, infant mortality rates per 1,000 live births jump from 85 to 107, decreasing to 86 in 2005.

The data suggests that immediately after the genocide occurred a marked deterioration in infant and child health. Between 1992 and 2000 Rwanda experienced a sharp increase in both infant and under-five mortality rates but the 2005 data indicates that these rates have declined and returned to the levels as 1992. In conclusion, infant and child mortality trends reverted and begun to improve in the past ten years.

Maternal mortality, defined as women deaths occurred during pregnancy, childbirth, or within 42 days of the termination of the pregnancy, remained high in Rwanda during past decade. In 2005, the maternal mortality rate was about 750 deaths for every 100,000 live births. This total has declined considerably since the end of the war when maternal mortality rate were estimate in 1,071 per 1000 live births between 1995 and 1999. According to UNFPA (2003), for every woman who dies as a result of pregnancy, some 30 surviving women experience lasting morbidities as a result of pregnancy complications, including anemia, infertility, pelvic pain, incontinence and obstetric fistula.

Many of the conditions that result in maternal mortality could be treated or managed safely with proper care. However, women in developing countries often give birth without any skilled medical care, and emergency obstetric services are rare. The war accounted for much of the lack of adequate prenatal and delivery services in the Rwanda case.

Hundred thousands of adults killed during the war and high rates of maternal mortality generated one of the most devastating impacts of the armed conflict in Rwanda: the dramatic increase in the number of children orphaned. Without their families as primary safety net, orphan children are at increased risk of violence, exploitation, and other forms of abuse when deprived of the protection of adults.


According DHS 2005, 21% of children under age 18 in Rwanda had lost one or both of the parents. As a consequence of the war, the proportion of children who have lost their parents in 2005 increased significantly with the age of the child: (2 percent at age 0 to 1 year; 6 percent at age 2 to 4 years and 16 percent at age 5 to 9 years). The higher rates of orphanhood were found at teens aged between 10 and 14 (36 percent) and 15 to 17 (41 percent) due to the effects of the 1994 genocide.

The 2005 DHS data also allows observing that the parental survival status influences school attendance of children aged 10-14 years old. When both parents are alive and children live with at least one parent, 91 percent attend school. In contrast, this proportion drops to 75 percent when both parents are deceased. Even so, as observed, girls in both situations are able to attend school in higher proportion than men.

From the early nineties and during the 1994 conflict many Rwandans abandoned their homes and their lands, fleeing internal conflict and civil war. While some fled across Uganda, Congo, Burundi and Tanzania borders, and even sometimes toward more distant countries, others remained in Rwanda seeking refuge in those provinces and municipalities. Many Rwandans who fled the armed conflict received international aid in refugee camps and were eventually repatriated under the auspices of the United Nations.

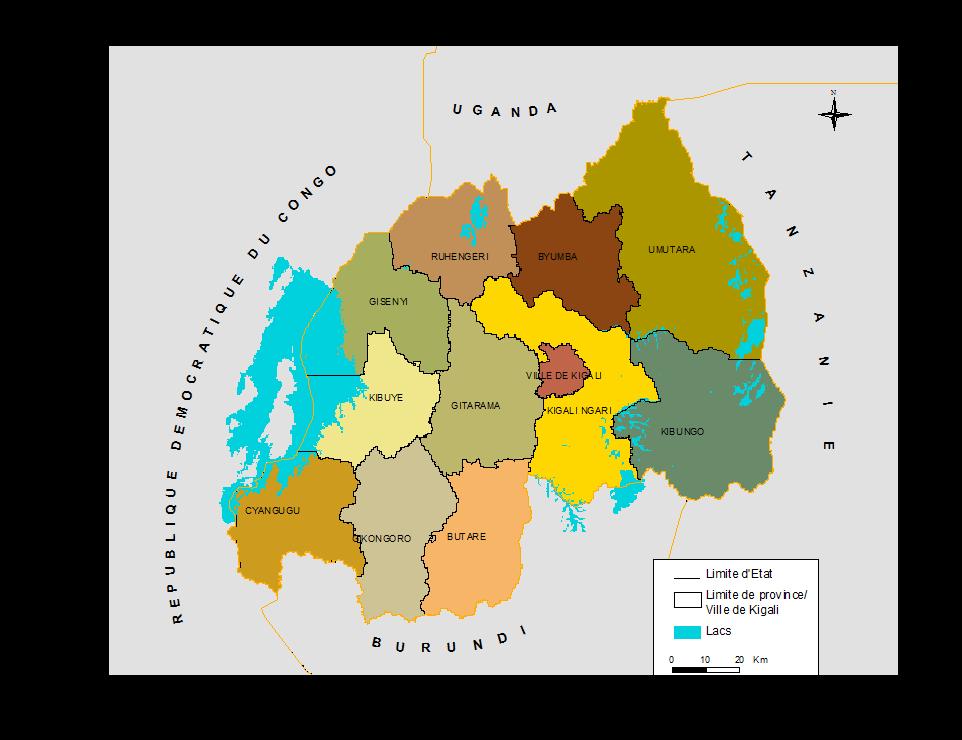
The population of Rwanda is composed in its majority by native (non migrants). These constitute, indeed, 80% of the total population against 20% of migrating people. It is possible to identify important variations of migration proportions between the administrative areas. Thus, the city of Kigali, the province of Umutara, Kibungo and Kigali count with a high proportion of migrants.


The population of the city of Kigali is formed of 64% of migrants. This percentage of migrants explains itself by the role of the city status as country capital and the consequent economic advantages with facilitates de search for jobs and social infrastructure, such as health and education facilities. In addition to the economic and social reasons, it is important to add that migrants often chose to get settled in Kigali for reasons of security or anonymity.

The province of Umutara, comes in second position as recipient of migrants. Half of its population declared to have lived elsewhere earlier. The raising proportion of migrants in this province is because it was constituted as a welcome site for the repatriated population after the process of pacification. The province of Umutara had welcomed an important number of refugees from Uganda and Tanzania.

In 1994, approximately two million Hutu refugees, most of whom suffered the consequences of the genocide and feared Tutsi retribution, fled to neighboring Burundi, Tanzania, Uganda, and Zaire (now the Democratic Republic of Congo). Many of them died for epidemics of cholera and dysentery which swept the refugee camps. It was the faster and most important displacement of populations of the contemporary African history.

After the conflict end (1996) started a return migration movement to the country. This movement was as fast as the one of the departure during the conflict. The number of former refugees who went back to Rwanda between 1994 and 1997 is estimated in 800 thousands.

The exam of the migratory status according to the area of residence shows important disparities. The migrating population constitutes more of 47% of the population of the country urban. In rural areas immigrant only constitute 14% of the population.


As can be seen by figures, the men predominate in the migratory fluxes toward the urban areas whereas the women are more numerous among the rural migration. In 2005, less than 5% of total inhabitants were born abroad Rwanda and hardly 2% declared to have resided earlier abroad. The most relevant countries contributing to international immigration to Rwanda are Democratic Republic of Congo, Burundi, Uganda, Tanzania and Kenya. The majority of international immigrants are decedents of former refuges who have been repatriated especially from neighboring countries after the 1994 war and genocide in Rwanda.

Sunday, November 7, 2010

Demographic Patterns in Rwanda at War: Part 1 - Impacts on Population Size, Gender Imbalance, Fertility and Marital Status

Andre Medici
Adriana Correa Alves


Rwanda was the scenario of one of the bloodiest armed conflicts in the modern African history. From April to July of 1994 an episode of ethnic violence between the Hutu and the Tutsi ethnical groups killed more than one million people (mainly Tutsis and moderate Hutus) in only about 100 days causing massive displacement (about 2 million people) to neighboring countries. The war and genocide took significant impact on the population structure and economy. The genocide responded to about 150,000 widows and 300,000 abandoned children. Rape and HIV infection increased in large proportions. The United Nations estimates that at least 250,000 women were raped during the genocide and a large number of those women were subsequently executed.

Although Rwanda suffered a major loss of human life during the genocide, the population size after the war remained essentially the same because over a million former refugees who were living for years in exile returned at the end of the war. Currently, Rwanda’s population structure is more stable with less displacement. People were settling fast and many are already reintegrated into the social and economic life while peace and security has been progressively assured. Many health facilities were destroyed during the genocide and even some units not affected by the conflict became without adequate staffing and equipment.

The demographic census data shows that Rwanda reached a population of 8.128,553 people in 2002 and 83% of this population was living in the rural areas. The urbanization increased substantially between 1978 and 2002. Estimated in 3.6% in 1978, the urbanization rate reached 6% in 1991 and 17% in 2002. Part of Rwanda’s population is concentrated in the capital Kigali, with 603.049 habitants in 2002 representing 44% of the country urban population. After the administrative reform of 2000 Rwanda counts with a total of 11 Provinces and the city of Kigali (see map).

Rwanda has the highest population density in Sub Saharan Africa, estimated in 321 inhabitants per square kilometer in 2002. The population is essentially young, with 67 percent of all Rwandans under the age of 20. Poverty remains a major barrier to development in Rwanda. Currently 60% of the population is below the poverty line and the poverty rates increased in the last 30 years.


The consequences of armed conflict in the size, composition and dynamics of the population are difficult to quantify. Armed conflicts often disrupt the vital statistical systems, the statistical offices and the possibilities to conduct censuses and household surveys. As a result, good and reliable data during the wartime years are usually unavailable for most countries affected by armed conflicts.

In order to present evidences about the demographic impacts of the Rwanda’s war we accessed a mix of official data sources, research findings and administrative records. Some data sources such as the Rwanda Demographic and Health Survey (DHS) and the National Census 2002 provide more robust demographic information. Demographic trends were built by pooling the DHS data in three moments: 1992, 2000 and 2005. The data sets covered a sample of 6,551, 10,421 and 11,321 women in the age group 15-49 years in each of these years, respectively. Details on the survey procedures and sampling design are available in individual survey reports.

The population structure by gender and age is crucial to the demographic and socio-economic analysis related with post-conflict contexts. During the 1994 war, most of deaths were concentrated in men and boys feeding the current Rwanda’s gender imbalance. The war led to an over proportion of females in all provinces, excepting Kigali city, where women represent only 46% of the population.

Figure 1 shows the Rwanda’s population distribution by age and gender in 2002. This demographic pyramid reflects the age and gender structure six years after the war. It has a very large basis and numerous irregularities in the demographic structure in several age groups as consequence of the war.

Figure 1
Rwanda Population Pyramid 2002


The pyramid base narrows rapidly as it reaches the upper age limits, indicating that fertility rates increased after the war and genocide. In 2002 the total fertility rate was estimated in 4.1 children per women in reproductive age. It indicates a resumption of previous procreation patterns following the reconstitution of the families and new unions’ formation. However, general mortality is still high. The total mortality rate in 2002 was estimated in 154 deaths per thousand inhabitants.

It is important to observe an unexpected irregularity in the number of children in some specific ages such as one, three and four years old. It could be attributable to an-over mortality lead by malnutrition and transmissible diseases in some bad years due to waves of famine and epidemics in the post-war context.

There is a significant population fall-off in the ages between 6 and 12 years old, indicating that the generation born in the war period (1990-1996) was affected by an over mortality (probably due violence and the lack of water, sanitation, nutrition and health care) and by the decrease in the fertility rates following the separation of the couples during the war. On the other hand, the disproportionately increase in the population between 11 and 20 years old is associated with the massive return of refugees which were sheltered in other countries during the wartime.

The huge gender imbalance produced by the war could also be observed in all ages at the demographic pyramid, but more extensively among the populations over 45 years old with an excess of women due the over-mortality of men during the war.

The sex ratio (measured as the proportion of men per women) is an indicator to evaluate the demographic balance between males and females. According this indicator Rwanda had 91 men for 100 women in 2002, mostly due by the effects of war and genocide. In urban areas the proportion of men is higher, but the inverse is observed in rural areas where the ratio reached 87.5 men per 100 women in 2002. The urban/rural differences in the sex ratio resulted mostly from the farming exodus of the mainly masculine populations in search of education and job opportunities in the cities, sometimes hopeless, contributing to inflate the urban poverty .

At the provincial level, sex ratios in 2002 oscillated between 87.1, in the Province of Kibuye, and 93.3, in Umutara. Inversely, in urban areas as the city of Kigali, where the male population is predominant, the sex ratio reached 117.5 in 2002.

Figure 2 represents the sex ratio at national level by residence - urban and rural - and age. The total sex ratio is bellow 100 in all age groups of 20 years old and more. This reflects the impact of war and genocide in 1994 that caused higher levels of male mortality in adult ages and mass emigration of males to neighbor’s countries.

Figure 2
Sex Ratio according age groups and residence area - Rwanda 2002


On the other hand, in urban areas the sex rate reaches an over proportion of males between the ages 20 and 60, as result to a massive demand for job opportunities by the male population.

Fertility in Rwanda plays an important role on population growth. Socio cultural values, mostly linked with conservative interests defend a pro-natality attitude. The data from DHS 2005 shows that the total fertility rate (TFR) among Rwandan women remains very high: 6.1 children for women in reproductive age, 4.9 in urban areas and 6.3 in rural areas. Data also shows that after the war context, between 2000 and 2005, TFR increased from 5.8 to 6.1 (figure 3) breaking a historic context of fertility decreasing experienced since the early eights.

Figure 3
Total Fertility Rates in Rwanda: 1983-2005


Existing literature explores the hypothesis of fertility decline during periods of armed conflicts, but does not discuss what happens after the conflict. As can be shown, the TFR in Rwanda was reduced during the war period (from 6.2 in 1992 to 5.8 in 2000), increasing again in the after-war period, when TFR returns to 6.1 in 2005. The analysis of the age specific fertility rates in 1992, 2000 and 2005 (Figure 4) demonstrates a similar pattern of the fertility rate: a decrease of the TFR in the ages between 25 and 39 during the period 1992/2000 and a return to an increase pattern, between 2000 and 2005, for the same age groups. So, armed conflicts lead to a fertility decline during the conflict time and to a fertility increase after the conflict. Even so, figure 6 shows a persistent decline in the fertility in the youngest (15-19) and oldest (40-49) age groups between 1992 and 2005.

Figure 4
Total Fertility Rate in Rwanda by Women Age: 1983-2005


Another interpretation to the present high fertility rates in Rwanda is associated with the persistent unwanted fertility in this country. Women in developing countries often have more children than they desire. A birth is considered “wanted” if the number of living children at the time of conception of the birth is less than the ideal number of children, as reported by the respondent. Bongaarts (1997) argues that unwanted fertility is typically higher in countries at intermediate levels of their fertility transition.

The Total Wanted Fertility Rate is the same as the Total Fertility Rate, only if unwanted births are omitted. If all unwanted births were avoided by the adequated supplies of contraceptive means for Rwanda's women in reproductive age, the TFR for Rwandan women should be 4.6 children in 2005, rather than 6.1 children. The TWFR is higher in rural areas (4.8) than in urban areas (3.6) and in the City of Kigali (3.4).

However, the data about the unwanted fertility in 1992 (before the war) is not available. If considered that the access to family planning was better in 1992 than it is in the present, probably the unwanted fertility in 1992 should be lower than in 2005. Rwanda has the second higher TFR among 12 sub-Saharan countries in which a DHS survey has been conducted since 2000. But if the reduction of the TFR between 1992 and 2005 had kept the same pattern observed between 1983 and 1992 the Rwanda's TFR probably would reach 4.6 in 2005, standing among the lowest levels in the Sub-Saharan Region on the early 2000’s. Based on that, certainly the armed conflict has an important role in the delay of fertility rate reduction in Rwanda.

Figure 5
Total Fertility Rates in 12 Sub-saharan African Countries in the Early 2000's


The age at which childbearing begins is an important demographic indicator because it has a direct effect on a women’s cumulative fertility, particularly when contraceptive means are not available. The younger a woman is when she begins childbearing, the greater her likelihood of having many children. At the same time, having children at too young an age can have negative repercussions on the mother’s health and can put her children at risk of dying. In Rwanda, in 2005, the median age at first birth of 22.0 years for women age 25 to 49 is identical to the median age observed for women the same age in the 2000.

Another important fertility indicator is the age of marriage for women. In low income countries, the women who marry earlier tend to have their first child earlier and give birth to more children, contributing to higher fertility rates. The duration of exposure to the risk of pregnancy depends primarily on the age at which women first marry. In Rwanda, where pre-marital fertility is uncommon or very low and the efforts to control fertility are not expressive, delays in marriage can cause a reduction in the number of women under risk of childbearing. The average age at first union is 20.7 years and first sexual relation is 20.3 years, which is relatively late compared with other African countries and has remained unchanged since 1992, when the median age at first union was around 20 years. On the other hand, men in Rwanda tend to marry at an older age than women. The median age for the first marriage is 25.0 years and the median age of first sex is 20.8 years. Even having the first marriage and first sexual relation later than other developing countries, Rwanda presents high fertility rates due the little space between pregnancy and the lack of contraceptive goods and services to the poor families.

Marriage remains practically the sole context of procreation in Rwanda. Among the women age group 15-49, 49 percent declared they were in a union at the time of the 2005 DHS. The proportion of never-married women decreases as age increases and it is rare to find a woman over 45 years old who has never been married (2 percent). In addition, 12 percent of Rwandan women live in polygamous households. Rwandan women tend to marry late: only 19 percent of those between the ages of 25 and 49 had married before they were 18 years old.

Of the 11,321 women surveyed in 2005 by DHS, 49 percent were in union (29 percent formal marriages and 20 percent in informal unions). The proportion of women who never married is 38 percent. Divorced women make up only 0.9 percent of women, separated women make up 9 percent, and widows are 4 percent. The proportion of never-married women has increased since the RDHS-II, from 34 percent to 38 percent.

Apparently the war does not present a strong impact in the marital status of women. The largest increase occurred in the 15 to 19 age group, of whom 90 percent were never married in 1992, 93 percent in 2000, and 97 percent in 2005 showing the trend to increase the first marriage age mentioned before. The number of married women has remained relatively stable during the last two surveys. The proportion of widowed women has dropped by half, from 8 percent in 2000 to 4 percent in 2005, given that the 2000 data was inflated by the armed conflict effect on the men’s disproportional mortality.

The second part of this article (to be published in the next post) will address the impacts of the Rwanda armed conflict in the use of contraceptive methods, infant, child and maternal mortality, orphanhood and migration.