Sunday, November 7, 2010

Demographic Patterns in Rwanda at War: Part 1 - Impacts on Population Size, Gender Imbalance, Fertility and Marital Status

Andre Medici
Adriana Correa Alves


Rwanda was the scenario of one of the bloodiest armed conflicts in the modern African history. From April to July of 1994 an episode of ethnic violence between the Hutu and the Tutsi ethnical groups killed more than one million people (mainly Tutsis and moderate Hutus) in only about 100 days causing massive displacement (about 2 million people) to neighboring countries. The war and genocide took significant impact on the population structure and economy. The genocide responded to about 150,000 widows and 300,000 abandoned children. Rape and HIV infection increased in large proportions. The United Nations estimates that at least 250,000 women were raped during the genocide and a large number of those women were subsequently executed.

Although Rwanda suffered a major loss of human life during the genocide, the population size after the war remained essentially the same because over a million former refugees who were living for years in exile returned at the end of the war. Currently, Rwanda’s population structure is more stable with less displacement. People were settling fast and many are already reintegrated into the social and economic life while peace and security has been progressively assured. Many health facilities were destroyed during the genocide and even some units not affected by the conflict became without adequate staffing and equipment.

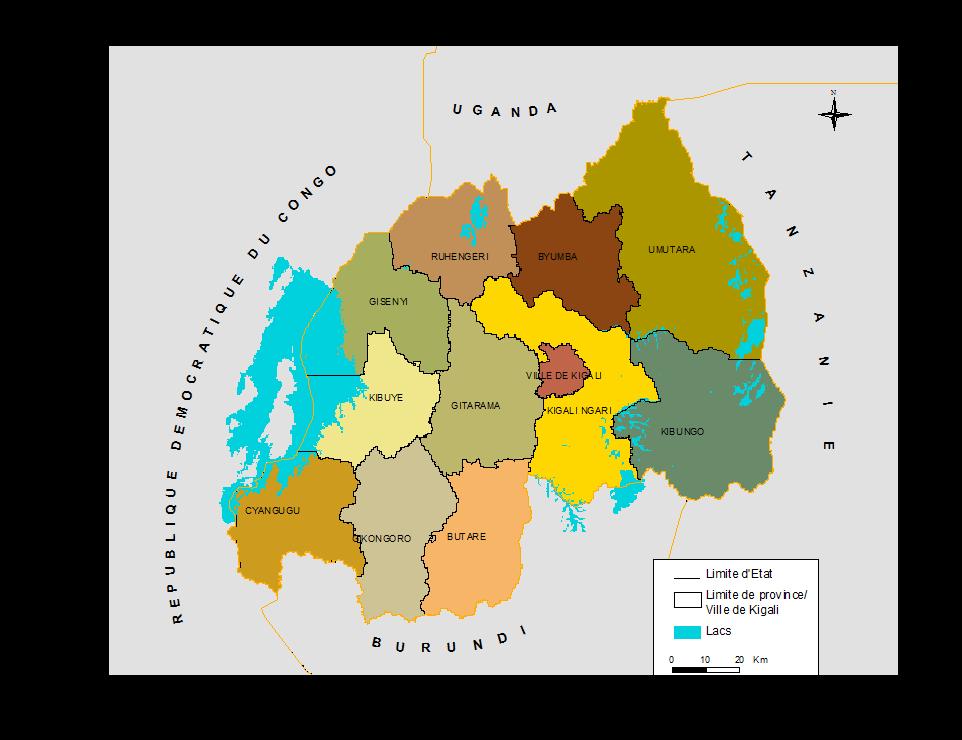
The demographic census data shows that Rwanda reached a population of 8.128,553 people in 2002 and 83% of this population was living in the rural areas. The urbanization increased substantially between 1978 and 2002. Estimated in 3.6% in 1978, the urbanization rate reached 6% in 1991 and 17% in 2002. Part of Rwanda’s population is concentrated in the capital Kigali, with 603.049 habitants in 2002 representing 44% of the country urban population. After the administrative reform of 2000 Rwanda counts with a total of 11 Provinces and the city of Kigali (see map).

Rwanda has the highest population density in Sub Saharan Africa, estimated in 321 inhabitants per square kilometer in 2002. The population is essentially young, with 67 percent of all Rwandans under the age of 20. Poverty remains a major barrier to development in Rwanda. Currently 60% of the population is below the poverty line and the poverty rates increased in the last 30 years.


The consequences of armed conflict in the size, composition and dynamics of the population are difficult to quantify. Armed conflicts often disrupt the vital statistical systems, the statistical offices and the possibilities to conduct censuses and household surveys. As a result, good and reliable data during the wartime years are usually unavailable for most countries affected by armed conflicts.

In order to present evidences about the demographic impacts of the Rwanda’s war we accessed a mix of official data sources, research findings and administrative records. Some data sources such as the Rwanda Demographic and Health Survey (DHS) and the National Census 2002 provide more robust demographic information. Demographic trends were built by pooling the DHS data in three moments: 1992, 2000 and 2005. The data sets covered a sample of 6,551, 10,421 and 11,321 women in the age group 15-49 years in each of these years, respectively. Details on the survey procedures and sampling design are available in individual survey reports.

The population structure by gender and age is crucial to the demographic and socio-economic analysis related with post-conflict contexts. During the 1994 war, most of deaths were concentrated in men and boys feeding the current Rwanda’s gender imbalance. The war led to an over proportion of females in all provinces, excepting Kigali city, where women represent only 46% of the population.

Figure 1 shows the Rwanda’s population distribution by age and gender in 2002. This demographic pyramid reflects the age and gender structure six years after the war. It has a very large basis and numerous irregularities in the demographic structure in several age groups as consequence of the war.

Figure 1
Rwanda Population Pyramid 2002


The pyramid base narrows rapidly as it reaches the upper age limits, indicating that fertility rates increased after the war and genocide. In 2002 the total fertility rate was estimated in 4.1 children per women in reproductive age. It indicates a resumption of previous procreation patterns following the reconstitution of the families and new unions’ formation. However, general mortality is still high. The total mortality rate in 2002 was estimated in 154 deaths per thousand inhabitants.

It is important to observe an unexpected irregularity in the number of children in some specific ages such as one, three and four years old. It could be attributable to an-over mortality lead by malnutrition and transmissible diseases in some bad years due to waves of famine and epidemics in the post-war context.

There is a significant population fall-off in the ages between 6 and 12 years old, indicating that the generation born in the war period (1990-1996) was affected by an over mortality (probably due violence and the lack of water, sanitation, nutrition and health care) and by the decrease in the fertility rates following the separation of the couples during the war. On the other hand, the disproportionately increase in the population between 11 and 20 years old is associated with the massive return of refugees which were sheltered in other countries during the wartime.

The huge gender imbalance produced by the war could also be observed in all ages at the demographic pyramid, but more extensively among the populations over 45 years old with an excess of women due the over-mortality of men during the war.

The sex ratio (measured as the proportion of men per women) is an indicator to evaluate the demographic balance between males and females. According this indicator Rwanda had 91 men for 100 women in 2002, mostly due by the effects of war and genocide. In urban areas the proportion of men is higher, but the inverse is observed in rural areas where the ratio reached 87.5 men per 100 women in 2002. The urban/rural differences in the sex ratio resulted mostly from the farming exodus of the mainly masculine populations in search of education and job opportunities in the cities, sometimes hopeless, contributing to inflate the urban poverty .

At the provincial level, sex ratios in 2002 oscillated between 87.1, in the Province of Kibuye, and 93.3, in Umutara. Inversely, in urban areas as the city of Kigali, where the male population is predominant, the sex ratio reached 117.5 in 2002.

Figure 2 represents the sex ratio at national level by residence - urban and rural - and age. The total sex ratio is bellow 100 in all age groups of 20 years old and more. This reflects the impact of war and genocide in 1994 that caused higher levels of male mortality in adult ages and mass emigration of males to neighbor’s countries.

Figure 2
Sex Ratio according age groups and residence area - Rwanda 2002


On the other hand, in urban areas the sex rate reaches an over proportion of males between the ages 20 and 60, as result to a massive demand for job opportunities by the male population.

Fertility in Rwanda plays an important role on population growth. Socio cultural values, mostly linked with conservative interests defend a pro-natality attitude. The data from DHS 2005 shows that the total fertility rate (TFR) among Rwandan women remains very high: 6.1 children for women in reproductive age, 4.9 in urban areas and 6.3 in rural areas. Data also shows that after the war context, between 2000 and 2005, TFR increased from 5.8 to 6.1 (figure 3) breaking a historic context of fertility decreasing experienced since the early eights.

Figure 3
Total Fertility Rates in Rwanda: 1983-2005


Existing literature explores the hypothesis of fertility decline during periods of armed conflicts, but does not discuss what happens after the conflict. As can be shown, the TFR in Rwanda was reduced during the war period (from 6.2 in 1992 to 5.8 in 2000), increasing again in the after-war period, when TFR returns to 6.1 in 2005. The analysis of the age specific fertility rates in 1992, 2000 and 2005 (Figure 4) demonstrates a similar pattern of the fertility rate: a decrease of the TFR in the ages between 25 and 39 during the period 1992/2000 and a return to an increase pattern, between 2000 and 2005, for the same age groups. So, armed conflicts lead to a fertility decline during the conflict time and to a fertility increase after the conflict. Even so, figure 6 shows a persistent decline in the fertility in the youngest (15-19) and oldest (40-49) age groups between 1992 and 2005.

Figure 4
Total Fertility Rate in Rwanda by Women Age: 1983-2005


Another interpretation to the present high fertility rates in Rwanda is associated with the persistent unwanted fertility in this country. Women in developing countries often have more children than they desire. A birth is considered “wanted” if the number of living children at the time of conception of the birth is less than the ideal number of children, as reported by the respondent. Bongaarts (1997) argues that unwanted fertility is typically higher in countries at intermediate levels of their fertility transition.

The Total Wanted Fertility Rate is the same as the Total Fertility Rate, only if unwanted births are omitted. If all unwanted births were avoided by the adequated supplies of contraceptive means for Rwanda's women in reproductive age, the TFR for Rwandan women should be 4.6 children in 2005, rather than 6.1 children. The TWFR is higher in rural areas (4.8) than in urban areas (3.6) and in the City of Kigali (3.4).

However, the data about the unwanted fertility in 1992 (before the war) is not available. If considered that the access to family planning was better in 1992 than it is in the present, probably the unwanted fertility in 1992 should be lower than in 2005. Rwanda has the second higher TFR among 12 sub-Saharan countries in which a DHS survey has been conducted since 2000. But if the reduction of the TFR between 1992 and 2005 had kept the same pattern observed between 1983 and 1992 the Rwanda's TFR probably would reach 4.6 in 2005, standing among the lowest levels in the Sub-Saharan Region on the early 2000’s. Based on that, certainly the armed conflict has an important role in the delay of fertility rate reduction in Rwanda.

Figure 5
Total Fertility Rates in 12 Sub-saharan African Countries in the Early 2000's


The age at which childbearing begins is an important demographic indicator because it has a direct effect on a women’s cumulative fertility, particularly when contraceptive means are not available. The younger a woman is when she begins childbearing, the greater her likelihood of having many children. At the same time, having children at too young an age can have negative repercussions on the mother’s health and can put her children at risk of dying. In Rwanda, in 2005, the median age at first birth of 22.0 years for women age 25 to 49 is identical to the median age observed for women the same age in the 2000.

Another important fertility indicator is the age of marriage for women. In low income countries, the women who marry earlier tend to have their first child earlier and give birth to more children, contributing to higher fertility rates. The duration of exposure to the risk of pregnancy depends primarily on the age at which women first marry. In Rwanda, where pre-marital fertility is uncommon or very low and the efforts to control fertility are not expressive, delays in marriage can cause a reduction in the number of women under risk of childbearing. The average age at first union is 20.7 years and first sexual relation is 20.3 years, which is relatively late compared with other African countries and has remained unchanged since 1992, when the median age at first union was around 20 years. On the other hand, men in Rwanda tend to marry at an older age than women. The median age for the first marriage is 25.0 years and the median age of first sex is 20.8 years. Even having the first marriage and first sexual relation later than other developing countries, Rwanda presents high fertility rates due the little space between pregnancy and the lack of contraceptive goods and services to the poor families.

Marriage remains practically the sole context of procreation in Rwanda. Among the women age group 15-49, 49 percent declared they were in a union at the time of the 2005 DHS. The proportion of never-married women decreases as age increases and it is rare to find a woman over 45 years old who has never been married (2 percent). In addition, 12 percent of Rwandan women live in polygamous households. Rwandan women tend to marry late: only 19 percent of those between the ages of 25 and 49 had married before they were 18 years old.

Of the 11,321 women surveyed in 2005 by DHS, 49 percent were in union (29 percent formal marriages and 20 percent in informal unions). The proportion of women who never married is 38 percent. Divorced women make up only 0.9 percent of women, separated women make up 9 percent, and widows are 4 percent. The proportion of never-married women has increased since the RDHS-II, from 34 percent to 38 percent.

Apparently the war does not present a strong impact in the marital status of women. The largest increase occurred in the 15 to 19 age group, of whom 90 percent were never married in 1992, 93 percent in 2000, and 97 percent in 2005 showing the trend to increase the first marriage age mentioned before. The number of married women has remained relatively stable during the last two surveys. The proportion of widowed women has dropped by half, from 8 percent in 2000 to 4 percent in 2005, given that the 2000 data was inflated by the armed conflict effect on the men’s disproportional mortality.

The second part of this article (to be published in the next post) will address the impacts of the Rwanda armed conflict in the use of contraceptive methods, infant, child and maternal mortality, orphanhood and migration.

Sunday, August 15, 2010

Armed Conflicts and Demographic Transition in Developing World:

Andre Medici
Adriana Correa Alves (1)


Introduction

In the last twenty years armed conflicts intensified in many of the poorest areas in the world, with severe consequences in mortality, human displacement, famine, destruction of public infrastructure and losses of physical and social capital. Armed conflicts reverse the benefits of the development process. Their devastating economic and social consequences are deep, remaining for years after the end of the conflict.

Many armed conflicts are associated with demographic imbalances. In fact, the persistency of high fertility rates, the rise of youth population, chaotic urbanization and migration processes, beside the scarcity of natural resources as cropland and freshwater supply, are frequently associated with the origins of civil wars in low income regions.

Armed conflicts generate direct consequences in mortality due war violence. All the three demographic dynamic components – mortality, fertility and migration – could be affected by armed conflicts and civil wars. Mortality in all age groups increases due direct human losses by the conflicts. Even affecting all age-groups, direct mortality in the conflicts is higher among adolescents and young adult male population. As consequence, armed conflicts multiply the number of orphans and widows, creating life disruption and increasing poverty among the survivors, especially women and children.

On the other hand, armed conflicts have also indirect impacts in mortality and morbidity accelerated by the increasing malnutrition, the disruption of family structures and family support to youth and children and the destruction of farmlands and public infrastructure. Health services, water supply and epidemiological surveillance generally don’t work properly during armed conflicts times. Increasing morbidity is one of the biggest consequences of civil wars and it is associated with the higher incidence of transmissible diseases such as AIDS and malaria during the conflicts and in post-conflicts contexts. The burden of diseases increases as consequence of the rising of physical disabilities and chronic diseases, especially those associated with stress and mental disorders.

Fertility generally increases as result of lack of access to family planning and other factors as rape and sexual violence against women. Some authors associate increases in fertility during and post-conflict with the women’s will to compensate the loss of children due to the war, but this argument still needs evidence to be proved.

International and internal migration intensifies due the generation of large waves of war refugees affecting family arrangements and family composition. In areas where displaced population is accommodated in refugees’ camps, family structure is disrupted because these camps are organized according gender and age groups. Family members are separated and children are not allowed to live with their parents. Age structure and gender ratios also change and turn imbalanced, due to disproportionately mortality of men and youth/adults. Men and women also may be differentially affected by the challenges and opportunity to reorganize their lives, to find households and to reinsert themselves into social networks and economic activities in the aftermath of armed conflicts.

Women and children suffer the most. Gender specific consequences include increased gender ratios, female-headed households, changes on the fertility patterns and unmet needs of reproductive health programs due the disruption of health systems and destruction of health facilities. Women often become caregivers for injured combatants and find themselves, as a result of conflict, unexpectedly cast as sole manager of a household, sole parent, and caretaker of elderly relatives. Children, especially the orphans, miss opportunities to attend school and health programs. Women and children are easy targets to sexual and gender-based violence and exploitation to the point of depression, mental illness and suicide. Women are disproportionately vulnerable to war associated risks such as human trafficking, forced labor or slavery, HIV/AIDS and other SDT and lack of access to education and health care. The violent environment during the conflict and post-conflict contexts reduces access or eliminate health information and health services, especially in outlying areas.

Demographic transition: balance and trends

Although the demographic transition is accelerating in most developing contexts, in low income regions, such as Sub-Saharan Africa, fertility and mortality are still high. Since the 1960s, population programs, especially those financed by international organizations or bilateral technical cooperation, have played a significant role in enabling couples to choose smaller families and to reduce fertility. However, armed conflicts could stop the spectrum of collaboration between these programs and the governments, slowing the gains in fertility reduction. In addition, two thirds of children in many Sub-Saharan African countries are projected to have HIV infection by the time they have reached age 50 (or die from HIV before).

The demographic transition is a generic concept associated with demographic changes from a context of high mortality and fertility rates to another of low mortality and fertility rates. Historically, the first classic demographic transition refers to the declines in mortality and fertility, as witnessed from the XVIII Century onward in several European populations, and continuing at present in most developing countries. The final stage of the first demographic transition was supposed to be an older stationary and stable population corresponding with replacement fertility (i.e. just over 2 children on average), zero population growth, and life expectancies higher than 70 years. The European demographic transition process was accelerated by the immigration. European countries intensively exported population to the Americas and other regions between the second half of XIX century and the first half of the XX century.

A new concept introduced by R. Lesthaeghe (2002) and others (2) in developed countries is the second demographic transition (SDT). The traditional concept implies that, at the end of the first demographic transition process, would be in place an ultimate balance between deaths and births and no “demographic” need for sustained immigration. The second demographic transition, on the other hand, sees no such equilibrium as the end-point. New social behaviors and changes in cultural norms bring new patterns such as a multitude of living arrangements other than marriage and the disconnection between marriage and procreation. These new social behaviors lead the fertility to sub-replacement levels and consequently to a no stationary population.

Instead, populations would face declining sizes if not complemented by new migrants (i.e. “replacement migration”), and they will also be much older than envisaged by the first demographic transition as a result of lower fertility and additional gains in longevity. Migration streams will not be capable of stemming aging, but only stabilize population sizes. Nonetheless, the outcome is still the further growth of “multicultural societies.” On the other hand, the SDT brings new social challenges, including those associated with further aging, integration of immigrants, less stability in family arrangements and high levels of poverty or exclusion among certain household types (e.g. single persons of all ages, lone mothers and illegal immigrants).

The demographic transition process tends to be much faster in developing countries. In Latin America, improvements in preventive health and medical care in recent decades lead to a fast to infant mortality reduction and increased life expectancy. Fertility has also declined faster, resulting in a quick transition from unprecedented population growth to low birth rates. Migration (both national and international) also affects the demographic transition in Latin American Countries. Colombian migrants, expulsed by the guerrillas, went to Amazon areas of Brazil and Salvadorians went to Guatemala, Honduras and Belize as consequence of armed conflicts.

One of the principal criticisms of the demographic transition concept is the questionable applicability to developing regions such as Africa, where the prerequisites for wealth, governance and information access to reduce both mortality and fertility are limited, especially in war and post-conflict contexts. The creation of good governance and sustainable economic growth, with increased provision of social rights as health, education, good jobs and social welfare, could pave the road to a stable process of demographic transition in these regions.


Armed conflicts and Demographic Dynamics: a brief literature review

The empirical literature on conflict and demography is scarce. Despite the relevance of the impact of armed conflicts on demography dynamic in poorest countries, especially due high mortality and forced migration, this subject is a new field of study (3). There is little structured analysis about the consequences of armed conflicts in the demographic patterns and most of the conclusions are anecdotic and could not be generalized. In most cases it is hard to found general patterns. Most of the consequences depend on the interaction between economic, social, cultural and political variables existing before, during and after the conflicts.

Conflict and violence have been referred as one of the principal causes for the erosion of physical, social and human capital in many countries. In a recent search for evidence about the demographic consequences of armed conflicts, Randall (4) analyzing the post-conflict demography of the Malaian-Tuareg, found mixed evidence of the effects of war on reproduction, mortality and family arrangements in three different stages: disorder, limbo and new order. Each one of the three phases has particular complexities and the armed conflicts could work as a catalyst to generate demographic change or to accelerate previously established demographic trends. The different escalation processes presented by the author’s framework serve to identify the related degrees of a conflict’s development and the peculiar forms of involvement by those experiencing the conflict.

The disorder takes place at the beginning of the conflict and may include violence and displacement according different environments. In the disorder phase could be observed biological and psychological impacts of the conflicts such as nutritional crisis, emergence of diseases, social stress, increased infant mortality and curtailed breast-feeding. The fertility and nuptiality tend to fall as a result of spousal separation, lack of privacy, abortion and reduced fertility due to under nutrition. The risk of rape also tends to increase.

During the limbo stage, that happens when conflict is established, people have no clear direction for the future. The population has few opportunities for sustainable self-reliance and generally suffers economic restriction and basic logistic problems associated with food distribution, security, health care and sanitation. This phase can last for several years and entire generations can grow up and matured under these uncertain conditions. In the third stage named new order, which take place during the post-conflict reconstruction, the main characteristic is the re-establishment of social and political order and the restoring of the semblance of normal life. The new order does not represent necessarily a return to the past patterns but generates an entirely new social, economic and demography dynamic.

Verwimp and Van Bavel (5) explain the cumulated fertility of Rwanda women and the survival of their children during and after the conflict through the theory of risk insurance or old-age security approach of reproductive behavior. This theory implies that fertility rises among refugee women as a response to lower chances of surviving. The refugees compensate the loss of children by having more children. Such behavior was particularly observed among the Palestinian population under armed conflicts by decades, where fertility is substantially higher than would be expected from their level of socio-economic development, according DellaPergola (6).

Girls’ survival in the first life-year is naturally bigger than boys’ survival in regular demographic contexts, but in armed conflicts areas the newborn boys have more chances of surviving than girls due family behavior and social norms. During armed conflicts boys are valued because they are early incorporated to fight as soldiers. Other social norms could also explain the over-value of boys by families. In many African countries, as Rwanda, only boys are heirs of land property. Families composed by girls have the risk to lose land property and access to food and water sources in the future.

Avogo and Agadjanian (7) explore the influence of the end of war and the postwar rebound in Angola’s fertility patterns. They show that the impact depends on the degree of exposure to the war and also the women’s socio-economic status. Ghobarah, Huth and Russett (8) analyzed several cross national World Health Organization dataset on 23 major diseases in population distinguished by gender and age groups and they found evidences that civil war increases the risk of death and disability through the breakdown of norms and practices of social order. The study also found that if a neighboring country recently experienced a civil war, women and girls are disproportionately affected by disability and death from AIDS.

In Latin America, where societies count on higher income and governance levels among other development regions, the existing literature shows that armed conflicts have impacted less the demographic trends and women and girls than in Africa. In Central-American Countries as Guatemala, Honduras and El Salvador, armed conflicts triggered intense migration flows and had demographic impacts such as delays in the reduction of fertility rates. For example, in the wake of the ensuing Honduran agrarian reform, in which only native Hondurans were allowed to own land, as many as 130,000 Salvadorans were forced to give up whatever jobs or land they had acquired and return to El Salvador. The exodus of Salvadorans from Honduras contributed to the so-called "Football War" between these two countries, in 1969, and the large number of returning Salvadorans worsened social and economic tensions within El Salvador itself.

In the next edition of this blog we will discuss some examples about how armed conflicts had affected demographic and health trends in some developing countries.

Notes

(1) Adriana Correa Alves is a Consultant of the Inter-American Development Bank and hold a PhD in Humans Right in Salamanca University (Spain).
(2) Lesthaegue, R., (2002) Second Demographic Transition, Vrije Universiteit Brussel (VUB).
(3) Brunborg, H., and E. Tabeau, (2005), Demography of Conflict and Violence: An Emerging Field, European Journal of Population, 21: 131–144.
(4) Randall S. (2005), Demographic Consequences of Conflict, Exile and Repatriation: a Case Study of Malian Tuareg. European Journal of Population 21: 291-320.
(5) Verwimp P. and Van Bavel J V (2005), Child Survival and Fertility on Refugees in Rwanda after the Genocide. European Journal of Population (2005) 21:271-290.
(6) DellaPergola, S. (2001). Demography in Israel/Palestine: Trends, Prospects, Policy Implications. Paper presented at IUSSP General Conference. Salvador, Brazil.
(7) Avogo W. and Agadjanian V. (2007). Reproduction in crisis: war, migration and fertility in Angola. A paper presented at the Population Association of America 2007 Annual Meeting Program. March 29-31, 2007, New York.
(8) Ghobarah, H. P. Huth and B. Russett (2003). Civil war kill and main people – Long term after the shooting stops. American Political Science review, 97(2), 189-202

Thursday, February 18, 2010

Some Reasons to Reform United States Health Care System

Andre Medici

1. United States - A country that does not get what it spends on health


The United States is a country sui generis in their spending on health. And it didn’t start today. In 1960, while the OECD countries spent around 4% of GDP on health, the United States spent 5%. In 2007, the OECD average had reached the 9% but the United States was at 16%. Moreover, while the other countries mentioned have achieved universal health coverage for its population, about 16% of Americans (46 million people) declared themselves without coverage that year and the coverage has not increa sed over the past fifteen years.

Looking more closely a data set of six OECD countries OECD 2007 that includes the United States, it appears that the U.S., spending an average of $ 6.102 U.S. dollars per-capita per year, of which $ 878 go solely to pay for medication, suffered from the worst performance in the indicators of quality, access, efficiency, equity. Suffered also from shorter lives and least productivity when compared with countries that spent between U.S. $ 2,083 (New Zealand) and $ 3.165 (Canada) per capita-year in health.

Even paying more for health, the Americans had worse access. In 2008, the chronic patients in the United States shared with Canadians the fact that only 26% could get medical appointments for the same day, a percentage that ranged between 60% and 36% in the Netherlands, New Zealand, Germany, France and Austria. Given the same set of countries, the U.S. had more problems getting healthcare at night or on weekends and had the biggest reported problems associated with coordination of care and medical errors on prescription and medication administration. Only 28% of doctors have patients electronic medical records, compared with rates higher than 80% in the Netherlands, New Zealand, England and Austria. In short, 54% of Americans with chronic illnesses said they had problems of access to medical care because of the high costs and administrative constraints. That percentage was down to 30% in the other OECD countries mentioned.

As a result, besides spending a lot more and being treated a lot worse, the Americans also die a little earlier than their peers in OECD countries. Life expectancy at birth in the United States in 2006 was 78.1 years, compared with 78.9 on average in other OECD countries. Countries such as Australia, Canada, France, Iceland, Italy, Japan, New Zealand, Norway, Spain, Sweden and Switzerland had in the same year a life expectancy at birth greater than 80 years. The infant mortality rate is also higher in the United States than the average of OECD countries (6.7 per thousand compared with 5.1 per thousand). Mortality rates from causes that could be treated if they had better health care reached 110 per 100 thousand inhabitants in the United States, values higher than those found in at least 14 developed countries.

The United States spends 49% of global health expenditures, but its population is only 5% of the world and yet this care is linked to all the problems mentioned above. Among OECD countries, it is the one with the highest share of private spending and household spending on total health expenditure.

The lower health coverage can be explained by a number of reasons: a) Being that health insurance is voluntary for most of the U.S. population, there is an increase in number of persons without financial access to health plans whose cost increases each year at rates higher than inflation, b) the number of companies that offer health benefits to their employees is shortening over time c) individual health insurance plan markets limit coverage of pre-existing conditions and reassuring the health plans may reject patients based on their individual risk.

As a result, health insurance became too expensive for individuals (and small and medium businesses) and 62% of family bankruptcies in 2007 was associated with the high health costs in the United States.

Among the factors that are associated with higher health costs in the United States there are: (a) high administrative costs (7.4% compared to 4.4% in average OCDE5 (b) high wages and salaries of doctors; (c) high use by professionals of specialized procedures or intensive care as a percentage of health services and (d) low use of processes to reduce cost and risk sharing between insurers and providers such as capitation payments.

2. What can the international experience teach us?

The challenge of the United States is to achieve greater coverage and quality for less money. This situation has aroused discussion in many countries. Some even say they can teach the Americans out of the rut and other blame, once again, the wild capitalism and privatization model for the failure in the American health. But the reality is far from it.

From the economic point of view, health is a unique industry and from the writings of the Nobel Prize Kenneth Arrow in the sixties, health economists have highlighted the economic peculiarities of this sector that do differ from others. Health expenditures are relatively inelastic and the costs of the sector grow primarily due to external factors (income levels and population aging) and internal sector behavioral trends (use of medical technology and management models).

For all these reasons, some countries have learned that without proper regulation they are not likely to increase the economic efficiency of the health sector. This regulation is increasingly complex, and must act not only to reduce market failures but also to avoid major failures of state, under the monopoly of public provision. In this context, it is worth sorting out what other countries may have to teach the United States, according to their degree of development.

a) Developed Countries

European countries, Japan, Australia, Canada and New Zealand, do not usually tell the Americans what to do. In fact, their health systems have also been improved by importing innovations from the U.S. experience in health management (as of diagnostics Related Groups - DRG - and separating the management of health service provision) in order to allow its statist models to correct their flaws through more state-regulated competition. These countries (with the possible exception of Canada), after seeing their models of welfare state skate on gigantism state, learned that corporate governance has its advantages and sought to balance their goals of universal coverage, equity and public ownership with transparency, out-sourcing and market incentives.

From the standpoint of regulation, developed countries have used market incentives and competition managed to avoid the pitfalls of the State in the health sector. They learned to use risk pooling and incentives to control costs and to negotiate better prices using procurement mechanisms for services with different providers. They work in a more structured system of information technology to streamline the use of personnel, material resources and clinical infrastructure.

European countries, for example, have as a basic criterion the regulation of the insurance market to ensure competition and managed risk-adjusted. Many make coverage compulsory and not voluntary and provide subsidies for those who cannot afford an insurance plan.

Many developed countries, where one important exception is the United States, have done better by using public health, primary care and models of health promotion and prevention in order to avoid the catastrophic costs of chronic diseases. They more effectively promote changes in risk behavior of their people, encouraging them to practice healthier habits, reducing sedentary lifestyles and reducing the number of other factors that lead to increased costs of medical care. Countries such as Chile, for example, after the dictatorship, succeeded in establishing a public coverage option for health plans and appropriate regulation to prevent cream skimming, social discrimination and denials of coverage by health plans.

Most developed countries have used models of care and more integrated health networks, as the example of general practitioners in England and the frequent use of regulation in health networks, facilitated by information technology and regulation and control the processes of reference and counter reference in health.

Last but not least, developed countries have advanced greatly in the use of epidemiology and perceptions of users about their health status in setting health priorities, based on studies of burden of disease. In setting priorities for health, they also define the protocols, the lines of care and delivery mechanisms of these services, study their basic costs and establish procedures to purchase public or private services that are based on these parameters.

Many of these studies, processes and ways of integrating medical care, even if they have been developed and tested by institutions and American universities, are not widespread in the country and are implemented on time and on a voluntary basis (as can be seen in the successful Kaiser Permanente experience). In other developed countries where public regulation of the sector is more present and strengthened, this development has been accelerated in recent years.

b) Developing Countries

Some developing countries, proud of their models, say they can teach the Americans what to do, but in fact, the success of these countries is conditional on passing situations without coverage for a reasonable offer of basic health services. Their challenge, therefore, was not to reduce costs through improvements in coverage and quality, but instead increase spending to cover a population largely lacking in services. Much of the struggle of so-called "sanitary reform movements" in developing countries is to increase rather than reduce spending on health.

Developing countries, especially in Latin America showed great strides in increasing the coverage, reducing infant and maternal mortality, structuring primary care and interdisciplinary teams of health and thereby, and improving the primary health care in the last twenty years. But health indicators (with some exceptions such as Chile) are still far from reach developed countries standards of quality. The challenge of quality and the gap of inequality in access are even greater in Latin America, for example, than in the United States.

Innovative models of public administration started a short time ago and can cheapen and improve the quality of the public health services (such as Social Organizations and State Health Foundations in Brazil) but are threatened or numbed by the action of justice and union movements of health professionals, which defend their work stable status and, at least, act against the needs of the poor. These, in the name of combating the specter of privatization of health, have actually privatized public resources in the hands of the corporatism of health professionals, leading the public system to work less and benefit those who have more access to control health time-schedules, access and health information.

They end up arguing (even implicitly) for the use of public institutions of direct administration in favor of the private interest of themselves and not in favor of common sense and for the interest of the neediest population.

Some successful strategies for primary care visits and health in remote areas and models of securing more regulated use in developing countries may be transferable to experiences in the United States, allowing for greater coverage and best supply regulation. However, given the epidemiological differences between the United States and these countries, issues such as quality and training would have to be reworked in the American context for these experiences in order to deliver better results.

3. The reform proposed by President Barak Obama

President Barak Obama was not the first to propose a major reform in the American Health Care System. Other U.S. presidents have also done so, including most recently Bill Clinton.

The Clinton Plan, between the earlier initiatives of health reform, was what came closest to an effective process to tackle the challenges of inequality and lack of access to health care in the United States, but the resistance from various sectors of society did not allow the plan to survive. However, it was the embryo of several reform initiatives and coverage extension initiated at the level of U.S. states, especially that of Massachusetts - the first statewide initiative to propose a plan for universal health coverage with mutual responsibility of the employers and families. These state reforms in recent years have cemented the consensus, albeit partial, that something should be done and some successful experiences - both the public and private sectors - has been able to demonstrate paths that could be taken to achieve greater coverage and quality at lower costs.

The current proposal to reform the U.S. health has been presented in public debate on the need to face five challenges: (a) extending coverage to all, (b) organization of care around the patient, (c) financial incentives to reduce costs, (d) medical care quality and efficiency, (e) public regulation and integration between public and private systems.

a) Making coverage accessible to all

The challenge here is to extend (making mandatory) coverage for all citizens, including the 46 million Americans who do not have health insurance. For this challenge to be won, some measures are being proposed by the Government and discussed by the U.S. Senate. Below is a summary description of the proposals in effect until October of this year.

As for individuals, tax incentives, such as deductions of up to $ 750 per person covered in the income tax would apply. At the same time, individual fines of up to $ 750 per person would also be applicable in case of no coverage be proved, excluding those who, due to lack of income, cannot afford to pay for health insurance;

Private companies, as originally proposed by the government, with more than 50 employees, will have to pay, as of 2013, a fine per employee not covered by health insurance. Small businesses (with fewer than 50 employees) will receive incentives such as tax relief for workers to join their health plans. The Senate has proposed, alternatively, that firms with more than 25 employees would pay 60% of the premium for employee and that the fines for part-time employee not covered would be only $ 375 per employee per year. Small businesses, instead of having tax deductions receive public subsidies to affiliate its employees.

The Health Insurance Market would be subject to regulatory processes on managing private plans and would offer new options, including public sector option and cooperatives. The plans must have a minimum set of benefits that will be reimbursed between 70% and 95% of its actuarial cost estimates. The plans must be differentiated by age groups (three to four groups, including the Senate proposal to create a special health policy for young adults) and should have portability to allow options of exchanging carriers and plans for patients without disqualification coverage.

The state would offer a public choice, based on the creation of a government agency that would offer health plans, and the ability to capture those people not included or accepted in the private health plans because they can not pay or because, due to their level of risk, would be rejected by the private sector. This agency does not subsidize the price of the plans, but would seek efficiency and prevent abuses by the plans in the search for patients that are easily profitable due their lower risk. Like Medicare, the agency does not provide direct health services, but will hire private providers. This could increase coverage for many of the 46 million uninsured and provide some option for their specific health problems, even if they were rejected by the existing health maintenance organizations.

b) Organization of Care around the Patient

The proposal, in this subject, is to create incentives to increase preventive care and healthy behavior of patients and encourage primary care services. In the first instance, the Federal Government proposes to develop a national strategy to promote prevention and health, investing and giving donor resources to support prevention programs in the communities, as well as financial incentives to individuals and health plans to improve strategies for promotion and prevention.

Some elements of the proposal are: (a) to eliminate the user’s co-financing for actions of promotion and prevention programs given that they have proven necessary in the public option, Medicaid and Medicare, (b) encourage the same practice in private health plans and, (c) establishing patients’ health promotion routines and encourage scheduling medical visits for prevention and risk assessment of health.

In the case of primary care services, the proposal is to increase the value of the primary care visits remuneration in Medicare at rates higher than the salaries received by the specialized doctors. Since large amounts of curative services to chronically ill older persons are increasing spending on Medicare, this proposal would encourage further promotion and prevention to reduce program spending in the public and most expensive U.S. health care sector. Some of the amendments proposed by the Senate are to raise bonuses to primary care physicians in up to 10% of the amounts billed during the first five years of reform, along with cuts in payments to other specialized medical services at 0.5%.

c) Financial Incentives to Reduce Costs

In this area, the Government's proposals and the amendments that the Senate is working are pilot projects of innovative payment providers. The innovations in the payment system appear in proposals for family clinics (medical homes), more transparent organizations of providers (more accountable health care organizations) and hospitals dedicated to cross reference and post-acute care.

These innovations will test cheaper and integrated ways to pay providers that, since they will prove functional, are applied to mass public systems such as Medicare and Medicaid. To increase incentives to these experiences, the government could establish special funds (grants) for its financing.

d) Efficiency and Medical Care Quality

Proposals related to this field would be structured as improvements in system productivity, comparative clinical effectiveness and improving the quality of services.

Improvements in productivity may arise aligning financial incentives to the more cost-effective procedures, constantly updating medical protocols and prospective payment systems in accordance with these principles and making up the basket of procedures recommended by these criteria;

Comparative Analysis of Effectiveness would be made possible through the establishment of research centers that allow assessing the clinical outcomes of different types of health interventions, allowing you to select those that best demonstrate proven results for cost incurred.

Improvements in Quality of Service would be achieved through the creation of the Center for Quality Improvement which will identify, evaluate, disseminate and implement best clinical practices, research and define the national health priorities to improve performance of health institutions promoting evaluations indicators and measures for quality in health. To this end, they also will discuss funding to improve the efficiency of services. This policy is expected to work with same way as the criteria used by government to establishes a national strategy for quality development in health.

e) Public regulation and integration between public and private systems

The Public-private mix of health services in the United States has existed since the time when public programs like Medicare and Medicaid came into existence, in the eighties, private health plans in some contexts, to perform the services, either through contracting for risk (capitation) or through direct purchase (fee for service).

However, the Obama plan goes a step further in this process, when establishing regulations in the markets for health standards that define new services, requiring health plans and providers to disseminate results and performance. The Obama plan also creates a public insurance option as a way of marking the market in accordance with the expectations of the government and to force private companies to have a performance close to that established in the new framework of regulating the system.

4. Impact and financial prospects of approval

Although the reform has not yet defined all of its elements and many changes still may modify the current proposed measures, it is expected that it would reduce the number of uninsured from 50 million to 17 million between 2012 and 2019. It is also expected to bring a cost reduction in the expansion of the system.

Without reforms, total spending on health in U.S., estimated at $ 2.5 trillion in 2009, could range between $ 4.4 and $ 5.0 trillion in 2020 (based on trend growth rate of 4.4 % to 6.5% per year), implying an annual increase in health spending between $ 173 and $ 227 billion, representing over 20% of GDP in 2020.

With the reforms, an optimistic scenario, health care spending in the United States would, on average, be reduced by $ 81 billion between 2009 and 2020 ($ 7 billion per year) or raise only $ 239 billion in the same period (U.S. $ 22 billion per year) 9. With this, the per-capita spending on health could stagnate or even shrink, considering as baseline a moderate recovery of the U.S. economy in the same period.

More importantly, is the fact that, besides the reduction of expenditures, it would improve a population's health, increasing coverage, quality, satisfaction and health outcomes and re-placing the country on a track for rapid increased life expectancy, as has occurred in other OECD countries.

However, there are many tough issues in American society to reform health care:

a. Resistance by the population (or a substantial part of the middle class) who believes in a model where the freedom of choice is an unquestionable value and that would be willing to pay more to keep it. Health reforms tend to limit the freedom of customers to choose professionals and health facilities of their choice;

b. Resistance by doctors and other health professionals who prefer a model that does to standardize their knowledge and also give you the freedom to offer alternative treatments, differentiated pricing and charging for it freely. The strength and corporate power of the American middle class causes these providers to handle well the autonomy of their profession by making care lines, protocols, DRGs and clinical evaluations far from their aspirations, especially in the east coast;

c. Resistance by medical companies, for reasons similar to those of physicians, and also by the need to act freely in the sale of services, having the freedom to reject contracts with health insurers or with corporations;

d. Resistance by insurance companies and health management (HMOs) that will not submit to public regulation the several aspects that negatively affect the financial health, such as rates or insurance premiums, use of co-payments, use of pre stocks-to limit the range of services offered or the possibility to refuse patients if they do not make actuarial;

e. Resistance by the health law firms who want to maintain a free market trading of court orders (and their free interpretation by the court) when patients feel the consequences of pain and suffering, psychological and medical errors.

All of these resistors are worth trillions of dollars and have made it increasingly difficult to manage the public pocket and the family finances to pay the amount of resources they represent. The result has been to increase the public deficit as a function of progressive underfinanced public programs such as Medicare and Medicaid, but also the families and underfinanced companies can no longer afford the health plan, reducing the coverage and quality of services delivered by health plans.

But there is an expectation that the proposed reforms can be passed in Congress and at the moment, several conservative segments of American society, including Republicans, have positioned themselves favorably. This fact is associated with some special features of the reform. It keeps the spirit of that health duty to preserve pluralism and competition, and freedom of choice in a capitalist society like the United States. However, it emphasizes the role of the state as regulator of a theme which is notorious for information asymmetry by increasing the COMPLIANCE of basic human rights and implementing the subsidies to socially disadvantaged groups.

In his presidential inaugural speech, Baraka Obama said he was not the first U.S. president to try a Democratic health reform, but he said he would be the first to not give up and ensure that reform is made during his tenure. What is now expected not only in the United States but throughout the World is that this promise is fulfilled.

Saturday, September 26, 2009

Innovations in Public Hospital Management - The Experience of Sao Paulo State in Brazil

Andre Medici

Background

Latin America experienced a fever of health reforms during the 1980’s and 1990’s. Given the increasing costs of health care and the impossibility to finance generous health coverage for all, as happened in the European since the 1960’s and 1970’s, mostly of these reforms had taught objectives such as increasing coverage and health quality with lower costs and efficient management. It was also expected reduced health inequalities and improved health outcomes.

To address these goals, many Latin American countries embraced changes in health financing (by increasing the participation of the public spending), health entitlement (by defining and addressing health rights) and health management (by separating the functions of financing, regulation and provision).

Brazil led one of the broadest and most visible world health reforms, creating a single health system (SUS) with some special features: (i) universal health rights; (ii) health management and delivery decentralization to States and Municipalities; (iii) single model of financing shared by all government levels; (iv) strong social participation; (v) service delivery model based on private and public providers, and; (vi) the existence of a complementary and voluntary private health insurance system (for 25% of population in formal labor market and middle class) regulated by a federal agency.

The alignment of all these objectives in a single health model was tried during the first ten years of the reform without reach good outcomes. First positive results were shown when health management and financial decentralization to states and municipalities became effective (in the late nineties) and different models to finance, manage and delivery health services were experimented. One of these models was developed in Sao Paulo State in the management of public hospitals.

Sao Paulo State in the Brazilian Federation


Densely populated São Paulo State is an economic powerhouse, and has also achieved high levels of social progress. More than 40 million Brazilians live in the State (22% of the national population - 2005) and more than 31% of the country’s gross domestic product (GDP) is produced there. A 2004 comparison of the human development index of all 27 Brazilian States puts São Paulo in the third position, below Santa Catarina and the Federal District. The percentage of illiteracy among the State’s adult population (age 15+) was 5.5%, well below the national average (11.4%), as well as that of the Southeast Region (6.6%). Life expectancy in the State was 73.4 years, which is also above the national average (71.7 years). The percentage of São Paulo’s population served with piped water, adequate sewage systems and regular waste disposal services in 2005 was 96%, 91% and 98% respectively.

Poverty in the State has been decreasing and cash transfer programs have not been as necessary to cover poverty needs as in other Brazilian states. Between 1993 and 2004, the percentage of the population living below the poverty line (according to national definitions) fell from 30% to 16% due the continuous State’s good economic performance. In 2006, only 9% of the population received governmental conditional cash transfers. However, for 94% of these families, the cash transfers supplemented other income; only 6% of the recipient families relied on the cash transfers as their sole source of income. On the other hand, according to recent living standard surveys[1], the mandatory conditions for families to receive cash transfers income (children’s vaccination and school enrollment) did not lead to significant increases in vaccination and school enrollment rates among both beneficiary and non-beneficiary families living below the poverty line, due to the high coverage / enrollment already achieved in the State. Vaccination among children under five years old is practically universal (99.5%) and school enrollment is above 97% for both beneficiary and non-beneficiary groups.

Health indicators reflect the State’s advanced epidemiological transition as well as the need to focus on preventing chronic disease. As of 2006, non-communicable diseases now represent the State’s major health challenge, with 85% of deaths attributable to chronic conditions, primarily cardiovascular diseases (33%); cancers (18%) and respiratory diseases (13%). Only 4% of the State’s mortality is linked to transmissible diseases. Among children younger than one year old, certain disorders originated in the perinatal period, due to maternal complications during pregnancy or birth labor, are a major issue, representing 60% of all related causes of mortality. External causes (such as traffic accidents and homicides) are the major cause of death for people between 5 and 49 years old[2]. These trends indicate that the State requires a robust combination of specialized promotion and prevention activities addressing chronic conditions, mixed with well-managed, comprehensive hospital care that can treat emergencies related to external causes. In order to achieve this objective, the State government is experiencing different management arrangement in order to find which one produces the best outcomes.

The structure and challenges of the State’s health system

The State’s population relies heavily on the public health system, especially the public hospitals that provide specialized care for complex health problems. Even though São Paulo is relatively wealthy, almost two-thirds of São Paulo’s population uses Brazil’s public universal health system (SUS) as the sole source of health care coverage. In 2008, although 40% of the state population was voluntarily enrolled in private health plans, the majority of this group continues to use public facilities, especially public hospitals, when they need specialized health care. Some public hospitals have made agreements with health insurance companies or health management organizations (HMOs) to be reimbursed for specialized health procedures.[3] The State’s hospitals have become centers for medium and high complexity care. Many state hospitals are important referral centers for highly specialized health care, not only for the State’s population, but sometimes even for the Brazilian population as a whole.[4]

The state health system is diffuse and complex, with variations in levels of responsibility and multiple cooperative arrangements. The state system is subdivided into 17 Health Regions that include all of the state’s 645 municipalities. About 36% of municipalities are legally allowed to manage all complexity levels of health services, including hospital care. The remaining municipalities only have capability to manage primary health care services. In addition, the 17 Health Regions are grouped in 10 Health Macro-Regions, 65 Health Micro-Regions; 345 assistance modules[5]; 125 assistance poles[6]; 8 regional health training centers and 15 inter-municipal health consortia, where the State is also one of the consortia members. Consortia are organized to facilitate issues such as shared used of hospital beds and patient transportation.

Different hospital management arrangements are used in the State. The SUS in São Paulo has contracts with 614 public (under municipal or state management) and private hospitals. Of these public hospitals, 70 are state-owned hospitals: 45 are directed-managed by the São Paulo State Secretary of Health (SES) and 25 are managed under the OSS autonomous model (management contracts). The other 544 hospitals are public (under municipal management) and private (for profit or philanthropic). From the total number of SUS public hospitals, 35 are teaching hospitals (27 under state management and 8 under municipal management) among those some are included in the 25 hospitals managed under the OSS regime.

New management models have been introduced in the State’s SUS hospitals and are showing positive results. Management issues can often profoundly affect health system performance, with certain processes (such as vertical management structures and centralized planning) generally associated with poor health outcomes and inferior performance. On the other hand, international experience has shown that new management models that emphasize autonomy in contracting, human resources and budgeting can improve efficiency, outcomes and customer satisfaction. The State’s Health Secretary introduced, in the last decade new models on hospital and ambulatory care management; outsourcing of auxiliary services in hospitals to be operated by private companies and other innovations that increased efficiency in the health system as described below.

The public hospital – private management model (OSS)

In the late 1990’s, São Paulo State introduced a new management model that allowed private entities, with State oversight, to manage public hospitals. This model is known as OSS (State Social Organizations Model) and is built on three pillars: the partners, management contracts, and the role of the state as regulator. Entities that enter into an agreement to manage a hospital must sign a management contract with the SES. Hospital management partners are institutions with recognized capabilities to manage hospitals, such as universities (like UNICAMP, USP, UNIFESP, UNESP) and philanthropic organizations (such as Santa Casa de São Paulo, Santa Marcelina Hospital Network). The OSS model began with 15 hospitals in the regions of the State with the neediest populations and lowest health coverage.

OSS management contracts are comprehensive and include distinct evaluation and reporting requirements:

(a) Management contracts are signed between the Secretary of Health and the managing partner, and specify the kind of assistance and services to be delivered as well as the agreed health goals;

(b) OSS contracts are supervised and evaluated by a special State Commission that includes representatives of the State Health Council, the Health and Hygiene Commission of the State Legislative Chamber and professionals chosen by the SES. The Commission evaluates the outcomes achieved against the contract’s stated goals;

(c) Management contracts specify that each OSS can only serve populations that use the SUS (i.e., not patients that have private health care coverage or other insurance);

(d) OSS hospitals are required to publish the OSS Accounts and other information in the Official State Newspaper as a means of guaranteeing transparency. In addition, OSS financial and accounting statements must be audited by the State Accounting Tribunal (TCE);

(e) To be designated as a hospital OSS manager, the bidding institutions are submitted to a selective process where some conditions have to be verified. One of these conditions is the following: the institution must prove at least 5 years of experience in autonomously managing their own health services with a good record of management performance and health results achieved.

Regulatory capacity has been a weak link in the OSS model. Although SES is defined as the regulator of the management contracts, its regulatory capacity has been the weak link of the OSS model. To increase the regulatory capacity of the SES and also to measure the comparative advantage of the OSS model, the World Bank is helping to create a performance and evaluation system based on indicators and fed by systematic data collection in all state hospitals. This system should enable the SES to: (a) evaluate the achievement and impact of management contract goals, and (b) provide a rapid and effective instrument to identify and address problems in hospital performance.

OSS management contracts should be an important instrument of accountability and transparency in the use of public funds for health. The OSS model gives more managerial autonomy to hospitals, but also it is expected to create higher levels of responsibility and accountability. Hospital management is expected to respond to or solve problems identified by a “control panel of core indicators” that should be monitored by the SES, as proposed by this Concept Note, but not yet implemented. In addition, OSS management teams must simultaneously work toward service production goals including quality assurance and customer satisfaction. Management contracts also establish some limits on personnel expenditures, and delineate patient rights. Contracts also govern OSS hospital data interface with central health IT systems, where a core set of indicators common to all hospitals, should be available on line and monitored by the SES. The OSS model should also be accountable to the state financial administration. In order to facilitate financial audits, the SES receives monthly health production cost reports and financial statements which are sent to the TCE, allowing a comparison between expenditures and goals achieved.

OSS hospitals should contribute to a more robust health system and increased patient satisfaction. Hospitals under the OSS model are expected to be active participants in local health systems and to participate, as directly-administrated public hospitals, in deliberative bodies of both the SUS and in the municipal health council systems. Currently, the availability of new managerial tools already improves the quality of health assistance and encourages social participation and the relationship between citizens and hospital management. Most patient complaints are solved and customer satisfaction increases without the intervention of SES.

Comparing hospital management models: some preliminary data


In a study conducted not long after their introduction, hospitals under the OSS model demonstrated better outcomes than those under direct administration. Studies published by the World Bank[7], which controlled for hospital size, equipment and characteristics of the target population, showed that hospitals under the OSS model present better performance on quality, efficiency and cost-effectiveness than directly-administered public hospitals. In 2003, only a few years after the model was introduced, the OSS hospitals produced more patient discharges, used hospital facilities more intensively, contracted fewer medical services, and had lower average costs per inpatient. At the same time, the OSS model adds more quality to the services, by guaranteeing patient integrity and accomplishing medical quality protocols. An extrapolation of the data in Table 1 hypothesizes that if these ten direct managed hospitals had used the same management processes as the twelve OSS hospitals they could have admitted 12,500 additional inpatients; produced 5,500 more required surgeries and saved R$ 67 million in the same time period.

A subsequent comparative study showed that OSS hospitals continue to out-perform direct management hospitals. Data collected by SES in 2006 shows that some OSS processes and cost indicators continue to improve performance in public health facilities. OSS hospitals are employing a higher number of qualified personnel and making more efficient use of existing public hospital facilities. At the same time, OSS hospitals had lower costs for some specific medical services, such as Intensive Care Unit (ICT) daily rates and medical exams as tomography and breast scanning.

Better outcomes in OSS hospitals are attributed to several of the management model’s characteristics. The above-mentioned studies suggest that the superior performance by OSS hospitals is associated with more autonomy in selecting and contracting managers, allocating budgets, hiring and firing personnel, defining and paying for performance incentives and managing contracts with suppliers. The OSS hospitals are financed mostly by global budget schemes, and provide for better monitoring and evaluation of contracts, and flexible bidding processes (avoiding the complexities of the 8666 and 8112 Brazilian procurement laws). At the same time, the OSS model provides more space for better monitoring and evaluation by the central government, by providing electronic data on outcomes linked with health goals agreed between the OSS and the SES.

Hospital information systems in São Paulo State

Hospital information systems in the state are fragmented and overlapping. In recent years, three separate information systems have been developed and implemented by the SES to collect data and information from hospitals in São Paulo State: (a) the first System tracks data in direct-managed hospitals (45 hospitals); (b) the second covers OSS hospitals (25 hospitals under autonomous management contracts); and (c) the last tracks data from teaching hospitals under the responsibility of the SES (35 hospitals). All this information should be complemented by the production data provided by other public information systems at national level, as the DATASUS and the IBGE/AMS that should be used in the analysis and evaluation reports to be produced by the SES.

Despite the existence of multiple hospital databases, very little comparative analysis has been done. Much information is duplicated in the three databases and some hospitals have their information collected by more than one system. However, the SES has not yet used the data to compare outcomes on specific indicators across the three management models. Existing systems allow SES to establish comparative indicators, parameters and cross analysis among different databases in order to built common indicators for the existing state hospitals.

A system that would allow comparative analysis would have many benefits. Some health professional unions have begun to criticize the OSS model; an analysis of data showing the relative benefits for both patients and health care staff would be a useful tool to compare the benefits of all management models. A comparative analysis would also provide input for the plan to extend the OSS model from the existing 25 to all 70 state owned hospitals by 2010[8] and to remove institutional legal and institutional barriers to extend this model to other state hospitals. In addition, comparative data would facilitate increased transparency and informed reports about the real effect of ten years of implementation of the OSS model in the SES Hospitals. Finally, comparative data would support the possibility of extending the OSS model to other health institutions such as pharmacies, laboratories, ambulatory services and even integrated health networks.

Currently the World Bank is helping the State on developing and implementing a system of core indicators to compare and evaluate hospital performance and outcomes under the different management arrangements currently utilized in the State of São Paulo. Once in place, the system will produce regular hospital performance indicators, analyze the indicators, publish continuous information, identify operational and efficiency bottlenecks in the hospital network and guide policy decisions and future opportunities for investment in the health sector. The overall benefit expected by implementing the use of this system of core indicators is the improvement of the state health results by using the OSS model.

Footnotes

[1] Governo do Estado de São Paulo, Fundação SEADE, Pesquisa de Condições de Vida (PCV), 2006.

[2] For teen-agers between 15-19 years old external causes represent 75% of all mortality.

[3] The existence of large share of the population covered by private health plans could introduce bias in some of the statistical parameters used to define the health needs at the local level. An analysis of this aspect in the case of São Paulo State can be seen in Bittar, O.J.N. (2005).


[4] That is the case of INCOR, a public hospital which is an international leader and referral center in the treatment of cardiovascular diseases;

[5] Assistance modules are regional units of the State Health Secretary responsible to assist the regional health network with specific and thematic health programs integrating basic and medium complexity care. This concept was defined in specific legislation of the Brazilian Ministry of Health (NOAS-2000);

[6] Assistance pole is a health management unit responsible to coordinate the health integrated care for a set of municipalities.


[7] See La Forgia, G. and Couttolenc, B (2008)


[8] Valor Econômico, February 17, 2009 “Gestão por metas será adotada por todos os hospitais públicos de SP”.

Sunday, May 10, 2009

Colombia: The Sinuous Path to the Universal Health Care


Andre Medici

The long and wide path to integrate health pluralism


Health care in Colombian is a pluralistic and complex system composed by four main delivery schemes[1]. Three of these schemes are based on insurance. They are the contributory regime (CR), for formal labor market workers, the subsidized Regime (SR) and the partial subsidized regime (PSR), for low income families no attached to the formal labor market. The last is the supply side coverage scheme (SSCS). This scheme is not insurance-based. It is organized as an open-access system and covers, potentially, all those that are not registered in the insurance schemes, known in Colombia as “vinculados”. On the other hand, the SR is basic financed by payroll contributions meanwhile the SR, the PSR and the SSCS are mostly public funded (taxes and transfers from the payroll contributions)

Since initiating reform in 1993, the Colombian Health System has utilized insurance schemes as the primary method of increasing coverage. Two main kinds of insurance schemes were created by Law No. 100, issued in 1993: the contributory regimen (CR) for formal labor market workers and their families, and the subsidized regimen (SR) for those working in the informal labor market without capability to pay. The latter are identified by a means-test mechanism called SISBEN[2].

Both insurance regimens – CR and SR -- include mandatory enrollment and are financed by different mechanisms. The CR is financed by payroll taxes applied to companies and workers[3]. These payroll contributions are consolidated into the Solidarity and Guarantee Fund (Fondo de Solidaridad y Garantía - FOSYGA), which finances all medical services for these workers and also transfers some funds to the SR. In addition to these FOSYGA transfers, the SR is financed by state and municipal tax revenues. In 2007, 49% of SR funding came from federal tax revenues, 36% from FOSYGA transfers and 14% from municipal taxes[4]. The SR is also financed by co-payments paid directly by clients when services are delivered. FOSYGA also finances part of the public health and public hospital expenditures.

To access health benefits, insured populations must be enrolled in a Health Promotion Company (Empresas Promotoras de Salud - EPS) which compete for clients and supervise service delivery. As insurers, the EPSs are either organized vertically (integrated model) or horizontally (network model). All EPSs contract with health providers, such as hospitals, clinics, ambulatories, labs and others[5], to deliver health services to their insured populations. The organization of these subcontracting arrangements may vary depending on the EPS model. The EPS are remunerated according to capitation mechanisms. The value of the capitation rate unit (Unidad de Pago por Capitación - UPC) received by the EPSs per each person affiliated is defined according to formulas that need to be reviewed and unified[6].

A third type of insurance coverage is available for those who do not meet the requirements of CR or SR. By Law, all workers in the formal labor market are covered by the CR regime and all informal workers must be enrolled in the SR regime. Those workers determined to be under the poverty line have their health insurance premiums subsidized by the government when using the SR. However, many informal workers are not eligible for the SR because they do not meet SISBEN eligibility criteria[7] due to high income or other factors. In these cases, the Colombian government established a partially subsidized regime (PSR), which provides a smaller health package and requires higher out-of-pocket deductibles and co-payments.

Both regimes – CR and SR - offer their insured populations a comprehensive health package called the Mandatory Health Plan (Plan Obligatório de Salud - POS) which should provide comparable coverage. The POS is a package of promotion, prevention, treatment and rehabilitation services. While in 1993, the package of procedures covered by the POS for the CR was more comprehensive than that covered by the SR, disparities have been progressively reduced in recent years[8]. The PSR still offers a smaller POS for its beneficiaries.

Citizens without any health insurance coverage can still access health services. Remaining populations not covered by the CR or SR are supposed to have access to health services by using public facilities (hospitals and ambulatory clinics) without the supervision of an EPS. This kind of coverage – known in Colombia as supply side coverage schemes (SSCS) -- has been deemed inefficient since it exercises little control over expenditures or labor patterns of health workers.

Current government policies and incentives designed to bolster the SR are not strong enough to eliminate the demand for supply-side health services. In 2003, the SSCS spent an amount equivalent to half of the public health expenditures and it still delivers services in big cities like Bogota[9]. The SSCS remains the main health provider scheme in smaller cities and rural areas.

In recent years, the national government has tried to reduce the use of SSCS and to transfer its covered populations to the SR. However, this strategy has been difficult to implement the small number of EPSs working under the SR and the strong opposition of health worker unions, whose members would have to change their civil servant status to private managed contracts in public hospitals[10]. The public sources for the SSCS, the SR and PSR are financed basically by general tax revenues from central government, Departments and Municipalities. These resources are complemented by copayments and deductibles paid by users. However, public hospitals organized as state social enterprises are also partially financed by the FOSYGA, basically for emergency care.


Health Reform to Date: Positive, but Challenges Remain


The 1993 reforms made significant improvements in coverage and Colombia has become a regional leader in coverage rates. According to official data, coverage rates increased from 58% to 90% between 1997 and 2007 and the absolute number of covered citizens grew from 22 million to 39 million, an increase which primarily benefited the poor.

Coverage grew rapidly, but not equally, and did not follow expected patterns. Under the three schemes (SR, SPR and SSCS), which covers lower income groups, coverage tripled between 1997 and 2007, jumping from 7 to 22 million people. Coverage under the CR regime grew at a slower pace during the same period (from 15 to 17 million), most likely due to the corresponding slow expansion of the formal labor market. Most policymakers believed that strong growth in the formal labor market during the 1990s would lead to reduced use of the public schemes by 2007 but it did not happened.

Health expenditures as a percentage of GDP have fallen slightly. Despite the coverage increase, cumulative health expenditures as a percentage of GDP fell from 7.7% to 7.3% between 2000 and 2005. This decline does not reflect a reduction in health spending but instead the country’s economic growth during this period (average 5.5% per year). In fact, during the same period, the percapita health expenditure in Colombia increased from 485 to 581 American dollars in parity purchasing power basis, according World Health Organization data. The proportion of Colombia’s health expenditures in GDP is about average for all of Latin America, but it is less than most of the South Cone countries.

Out-of-pocket expenditures have also fallen. Compared with other Latin American countries, Colombia has one of the lowest out-of-pocket expenditure rates in the region (estimated at 6.4% of the GDP in 2006, compared with 33.3% and 52.4% for Brazil and Mexico, in the same year, respectively. This low expenditure rate demonstrates the powerful effect of Colombia’s health insurance model on the reduction of catastrophic family health expenditures.

In spite of some variances in data, the trend toward reducing coverage inequities is clear. According to Colombia’s 2005 Demographic and Health Survey (DHS), 68% of the population was covered by health insurance (CR, SR and PSR). This figure contrasts with the 81% coverage rate, presented by the data from administrative records in 2005 given that in these records are registered some population under the SSCS However, the DHS data does show a sharp reduction in coverage inequalities in recent years.

Between 1995 and 2005, all income quintiles experienced increased health insurance coverage and the disparities between the poorest and richest quintiles narrowed significantly. Health insurance coverage in the poorest and richest quintiles increased from 3% to 57% and from 61% to 86%, respectively. In addition, preventive and control care coverage rates increased from 49% to 79% in urban areas and from 29% to 78% in rural areas between 1997 and 2003 according DHS data. An improved performance in the rates and equity of health coverage is usually related to better health outcomes.

In addition, other risk factors have yet to be brought under sustained control. For example, neonatal tetanus mortality rates have bounced between lower and higher rates during recent years, due to the failure to increase coverage of the amplified immunization program (PAI). Between 2003 and 2006, the coverage of tetanus vaccine among children under five years old declined from 93.3% to 88.2% after an increase from 79.5% to 93.3% between 2000 and 2003. Improvements have been made in maternal health, although national-level data can obscure extreme regional disparities. The percentage of mothers receiving post-natal care increased from 46% to 64% between 1995 and 2005. This improvement, combined with an increased share of births attended by skilled personnel (BASP), led to a reduction in the maternal mortality rates (MMR), which declined from 105 to 70 per hundred thousand births between 2000 and 2006.

Part of this achievement could be explained by the percentage of BASP, which increased from 93% to 97% during the same period. However regional differences in MMR are even higher than IMR. Some Departments such as San Andres, Valdes and Vichadas, did not even register maternal deaths in 2005. In the poorest Departments, like Guainia, the MMR reached 386 per hundred thousand in the same year. Some of the health system’s main challenges to improving health outcomes, especially in child and maternal mortality, may be related to the nature of coverage. Considering the three modalities of health insurance affiliation in Colombia (CR, SR and no affiliation), it is easy to demonstrate the correlation between better outcomes and higher rates of coverage (CR, SR).

According 2005 data, infant mortality rates tend to be lower in the Colombian Departments with higher health insurance coverage rates. Of course, other factors could also affect this correlation and more careful data analysis is necessary. Non-communicable diseases are becoming a critical issue. Colombia is in the middle of a rapid demographic and epidemiological transition, and mortality rates for non-communicable diseases (NCDs) are increasing very quickly. Between 1980 and 2005 the mortality rate for cardiovascular disease and stroke increased from 79 to 98 per hundred thousand inhabitants. The rising challenge of NCDs demands new POS designs and strategies in order to include more cost-effective protocols for promotion, prevention and treatment of chronic conditions.


The System under Pressure


Legal and Financing Issues Legal challenges to coverage limitations have created urgent pressure for further reform. In the past two years, the Colombian government has experienced a sharp increase in judicial complaints (tutelas) demanding payment for health procedures not covered by the two insurance plans (CR and SR). Most of these complaints have been successful, and, as a result, insurance providers have been forced to pay corresponding medical bills, creating financial pressure not only on the EPSs, but also the FOSYGA and the public budget.

In response, the Supreme Court issued a 2008 ruling that defines patient rights regarding coverage. The increase in legal challenges prompted the Supreme Court to issue the Sentencia T-760 in July 2008. The Sentencia establishes a Bill of Health Rights and stipulates that the Colombian Government must protect all citizens under the following five circumstances: (a) health services are not delivered because of the patient’s inability to pay, including for catastrophic or high-cost procedures; (b) health services are stopped without clear medical reasons; (c) patients do not receive adequate information about their treatment options; (d) patients face unnecessarily burdensome bureaucracy or administrative procedures that might prevent access to services; and (e) patients are asked to pay separately for services which are part of an integrated treatment plan.

The Supreme Court’s Sentencia also requires the Colombian Government to rapidly establish a strategy to eliminate coverage and financing disparities and to increase portability among EPS. Under the 2008 ruling, the Government must create an Action Plan by February 2009 that will set out the strategy to create a single health package (POS) for all children under 5 years old. This single POS is to become effective by the end of October 2009. The Action Plan must also propose interim actions to eliminate ambiguities in POS guidelines and protocols and must define actions to be taken toward a universal single POS, eliminating differences between plan types, increasing portability among all plans offered by the EPS and creating patient capability to pay in order to assure universal coverage for all Colombian citizens by 2010.

The Sentencia defines two new health challenges facing the country: (i) improving the quality of health care, and (ii) guaranteeing the feasibility of a universal and unified health insurance in a context of increasing labor market informality.

To improve the quality of health spending, the health system needs to establish better incentives for insurers and providers. Many of public hospitals in Colombia have been systematically bad evaluated by poor management performance and outcomes. Most of the causes are related with lack of financial incentives to the main stakeholders and lack of managerial skills to improve quality and timely outcomes. Recent changes in health-related legislation have introduced new quality standards for health services delivery. For example, some payments to providers (IPS) that were previously tied to price margins became, after 2004, dependent on the provider’s quality of health management (including the capacity to follow-up patients after clinic visits or hospitalizations). However, there has been little evaluation of the impact of this new legislation on the achievement of better health outcomes. Other national and international experiences of incentives to improve quality have not been sufficiently applied or tested in the Colombian case.

Given Colombia’s increasing labor market informality, the feasibility of current health system financing should be evaluated, as well as the capability to pay of the large populations covered by the SR or the SSCS. For example, some estimates by Colombia’s National Department of Planning (DNP), based on the 2003 Living Standard Survey (ECV), found that some SR beneficiaries should be part of the PSR according their income. On the other hand, high social contributions, which reached 53% of payroll numbers in 2007, have been identified as one of the factors responsible for the reduction of Colombia’s competitive advantages in the global economy.

The future and feasibility of the Supreme Court ruling on creating a single universal system depends on a broader and equal access to health in Colombia. This process should be conducted by implementing some previous actions as piloting experiences to extend coverage, to improve the quality of health care, to reduce costs, to increase promotion and preventive measures (so scarce in the context of the current Colombian Health System) and to guarantee the financial and institutional feasibility of a single health package. But should be the government able to buy this challenge and does the society have enough willing to pay for it?


NOTES

[1] There are two other health schemes – the voluntary enrollment insurance, which comprise a small segment of the high income families and could be overlapped with the CR, and the special regimes for some civil servants categories as military, judiciary, congress members and others. According 2003 estimates these schemes spent 8% and 2% of the total health expenditure, respectively (See Acosta, Ramirez and Canon, 2005). Given that both schemes are not related with the Colombian Health Reform and represent small portion of the enrollment and health spending, they will not be discussed in this concept note.

[2]The SISBEN (Sistema de Identificación de Potenciales Beneficiarios de Programas Sociales) uses a proxy means test index designed by the National Planning Unit (DNP), conceptually similar to the mechanisms used in Chile’s CAS or Mexico’s PROGRESA beneficiary identification system. The SISBEN index is a function of a set of variables including availability and quality of housing and basic public services, possession of durable goods, human capital endowments and current income.
[3] The contribution to the FOSYGA was 12.0% of the payroll until January 2007, when it increased to 12.5%.

[4} In addition the one percent remaining was financed by other sources as “Cajas de Compensacion”.

[5] Health providers are called IPS (Instituciones Proveedoras de Salud) according the definitions used by the Colombian health system.

[6]In fact, the UPC paid in the SR regime is almost 60% of the value of the UPC paid in the CR regime. Between 1997 and 2003, the real value of the UPC decreased in 20% in the SR and in 11% in the CR.

[7]The SISBEN score allows the ranking and stratification of potential beneficiaries based on the severity of poverty: level 1 for the poorest which roughly correspond to the national definition of extreme poverty; level 2 for the traditional definition of poverty line; and level 3 for three times the extreme poverty line. In total, six levels of SISBEN are calculated, with total scores ranging from 0 to 100. For the subsidized regime, the cut-off score for eligibility is 22 in urban areas and 32 in rural areas which comprises SISBEN levels 1 and 2.

[8]The ultimate definition of procedures and pathologies covered by the POS in the SR is listed in the Acuerdo 000306 issued on August 16, 2005 (published as Diario Oficial 46.096, November 18, 2005). However the POS in the SR still offers less coverage than the POS in the CR, especially regarding ambulatory services and second and third complexity level interventions.

[9]According Acosta, Ramirez and Canon (2003) the distribution of the Colombian health public expenditure was the following: 41.4% to the SR; 9.1% to public health and 50.5% to cover the population enrolled in the SSCS. Using 2003 household surveys we can observe that 35% of the Colombian population is affiliated to the CR; 24% to the SR and 41% are “vinculados”. At least two thirds of the vinculados were covered by the SSCS in 2003 according administrative records and the remaining population was supposedly not covered.

[10] The EPS dedicated to provided services to the SR are called ARS (Subsidized Regime Administrator Companies). Public Hospitals can be organized under ARS schemes, as State Social Enterprises (Empresas Sociales del Estado), but only a few public hospitals in Colombia have fully implemented this management model.